Technical Analysis on Bitcoin: Key Areas to Watch

Bitcoin has been consolidating since my update yesterday. For now, there are no signs of a trend reversal. We’re clearly still looking very bearish. Let’s discuss some key areas to keep an eye on...
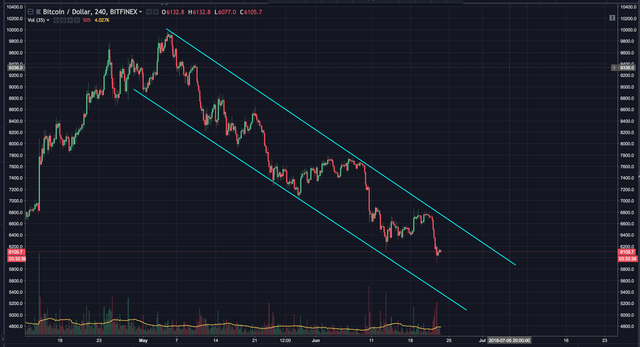
First, we’re still operating within the larger down trending channel. A break above this channel would likely indicate the start of a trend change. Looking at the chart, it’s very clear bitcoin has a long way to go before that happens. This makes it very clear the bears are in full control of the market right now.
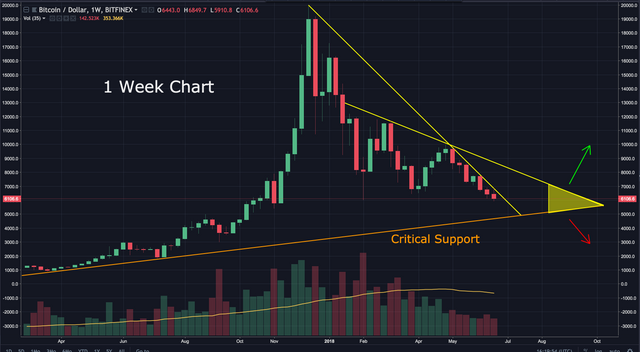
Zooming out to the weekly chart, we can see key areas of descending resistance, as well as an ascending support line. A break above the first resistance line would be a big win for the bulls, and possibly the start of a trend reversal. If bitcoin is unable to break the resistance, the support needs to hold. This support is critical. If it breaks, we're likely to see bitcoin drop to $4,000 or lower.
Assuming it’s able to break past the first resistance line, the next area to watch is the apex where the second resistance line and support meet. This is the area where another major move is likely...up or down.
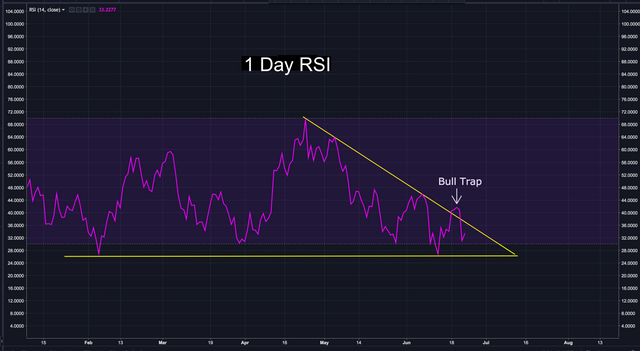
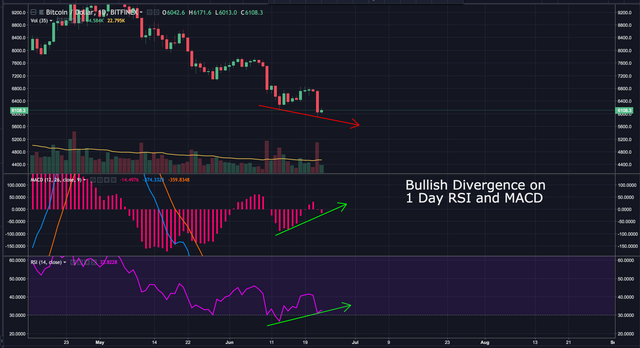
Looking at the 1 day RSI, it’s now clear the temporary breakout was a bull trap. It’s since dropped right back into the wedge. Bitcoin is now approaching the apex of this wedge. Either the support or resistance will break in the next week. This will be another big test for the bulls. A break below will likely mean a drop to at least $5,500.
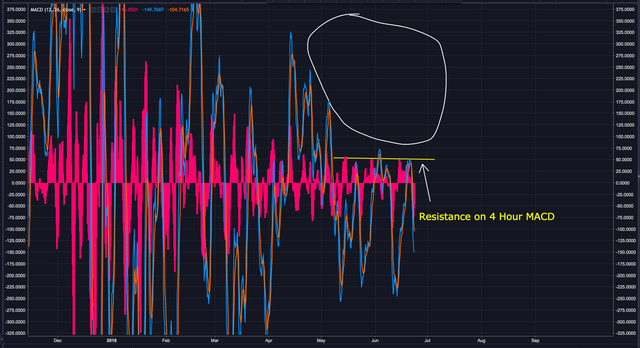
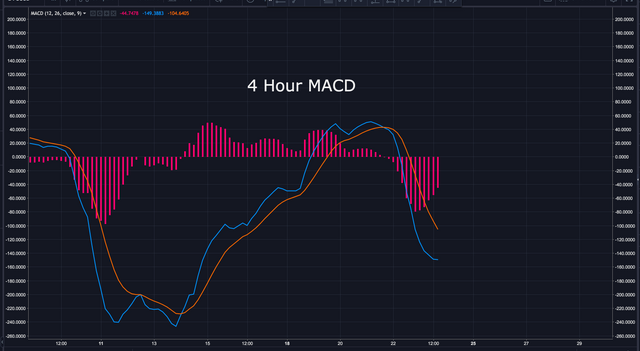
The 4 hour MACD has been unable to break past 51 since early May. It’s as if the buyers suddenly vanished. This is another indicator to keep an eye on. When the MACD breaks above that resistance, it MAY be an indication the down trend is starting to bottom out.
The 4 hour, and 1 day MACD look like they're starting to move more sideways than down.
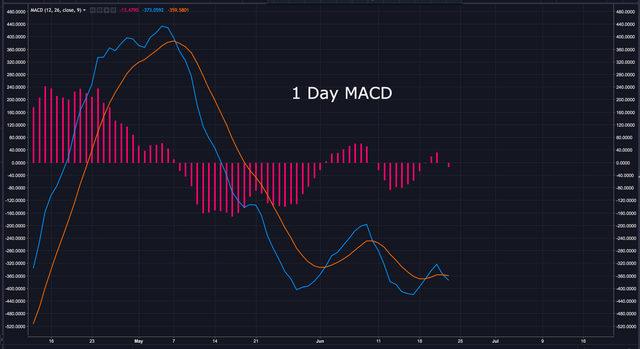
The 1 day RSI and MACD are showing bullish divergence. This tells me we might see a temporary rise in price. Given the bearish look of the chart, I don’t believe this will be a trend reversal.
While the $6K support is holding for now, I do believe my prior count is still very much in play. I don’t think wave 2 has completed quite yet. We can see it’s currently risen to the 0.236 fib level, where it’s found resistance. The discussed bullish divergence tells me it'll most likely rise to at least the 0.382 fib level (around $6,270). From there, I’d expect it to drop and begin wave 3.
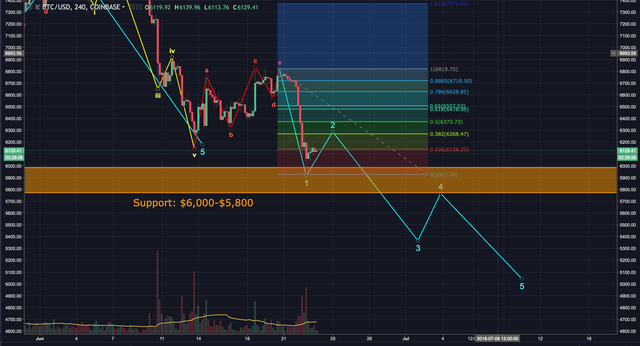
The next major test will be when wave 3 approaches the $6,000-$5,800 support zone. At that point we'll get a good idea just how weak the market actually is. If the bulls can successfully defend the support zone, we'll likely see consolidation right up until the first descending resistance line we discussed earlier.
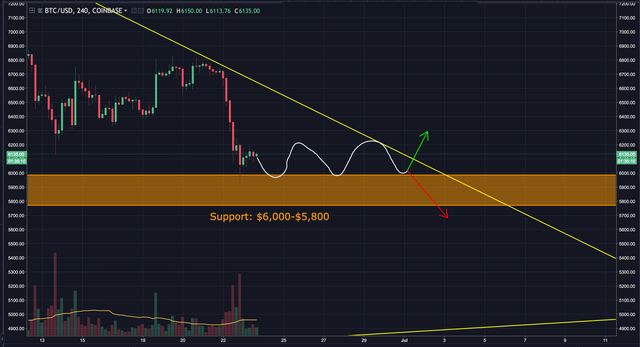
If the support zone fails to hold, my bearish count will be validated.
Trying to time this market is very difficult. The truth is, we need to be patient, monitor the key indicators I’ve discussed and trade on probability, NOT emotion. Currently, I don’t see any good risk to reward buy setups. Key support areas to watch are as follows:
The $6,000-$5,800 support zone I discussed earlier. Below that, there’s some weak support at $5K. Below that, we find strong support at $4,500. Below that, there’s strong support at $4,000.
If you’re only a buyer, this is a good time to sit on the sidelines and wait. As I said, trying to time the bottom of a downtrend is nearly impossible, especially in this market. In my opinion, it’s best to wait for a confirmed trend reversal. You won’t catch the very bottom, but you can ride the wave up. Best of all, you don't loose money.
If you’re a seller, you’re loving this market. The next major opportunity for bears will be if bitcoin decisively breaks below the $5,800 support. If that happens, shorting, with a conservative target of $5,100, seems logical based on current information. As always, if you're uncomfortable, just wait. There will be plenty of opportunity in the future.
Let’s see how things play out over the next 24-48 hours.
BIAS:
Short Term: Bearish
Longterm: Very Bullish
I hope this has been helpful. I’d be happy to answer any questions in the comment section below. Thanks for stopping by.
If you found this post informative, please:

If you don’t have an account on Binance, I STRONGLY recommend getting one. They’re usually the first to get reputable coins, have excellent security and second to none customer service. You can sign up here free of charge: https://www.binance.com/?ref=16878853
FYI…I just started a Facebook and twitter page where I’ll post analysis, along with other relevant crypto data from myself and others. If you’d like to be notified as soon as updates reach Steemit, the twitter handle is @Workin2005 and the Facebook page is https://www.facebook.com/Workin2005/
Published on

by Workin2005

Realistic, seems you were right. Learned a lot from you. But it seems bulls are too weak atm.
Thanks @guardian2100
How much prizes???? Your prediction in 2018 last,, my dear friend,,,
Looks like we are heading for the 4 - 4.5K.
Very possible.