Trading with Accumulation / Distribution (A/D) Indicator - Crypto Academy / S4W5 - Homework Post for @allbert
Hello Steemians,
1 Explain in your own words what the A/D Indicator is and how and why it relates to volume. (Screenshots needed).
The Accumulations and Distribution Indicator is a special type of technical indicator which is meanly influenced by the market forces, that is demand and supply. Their trends are dependent on the activities or actions of the market forces (Demand and Supply). Therefore, the more people buy a particular assert the higher the price increase whiles the more the selling the more the price decreases.
This Indicator has really helped traders to make strategic moves with this informative in order to maximum profit margins. In the sense that just studding the actions of the market forces can help predict the next move or price trend of a particular asset. Every trading platform with how its Accumulation Distribution Indicator looks like on the chart.
The Accumulation and Distribution Indicator is related to volume because it simply measures the Inflow and Outflow of money of a particular assert. Meaning it measures the price in relations to the volume of the particular asserts to determine whether its being accumulated or distributed. Meaning it helps you know how much money is flowing in and out.
2- Through some platforms, show the process of how to place the A/D Indicator (Screenshots needed).
Now that we have all the information about the Accumulations and Distribution Indicator, lets take a look at how we can add it our chart. I will be using Trading View for this demonstration.
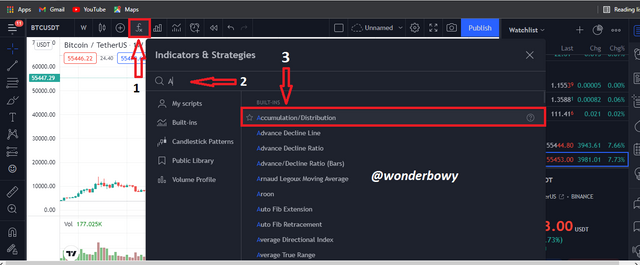
- Click on the fx symbol, and then type Accumulations within the search box and from the possible options click on Accumulations/Distribution to add it to the chart.
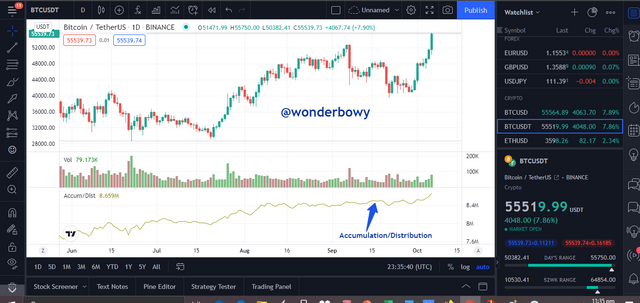
- Accumulation//Distribution Indicator added to chart successfully.
Question-3- Explain through an example the formula of the A/D Indicator. (Originality will be taken into account).
The Money Flow Multiplier is given by;
[ (Closing Price - Low price of the period ) - (High price of the period - Closing price)] / High - Low
Money Flow Volume
Given by;
MFV= Money Flow Multiplier * Period Volume
Finally, we have Accumulative and Distributive Indicator as;
A/D = Previous A/D + Current Period Money Flow Volume
Lets take a look at an example from the screenshot below...
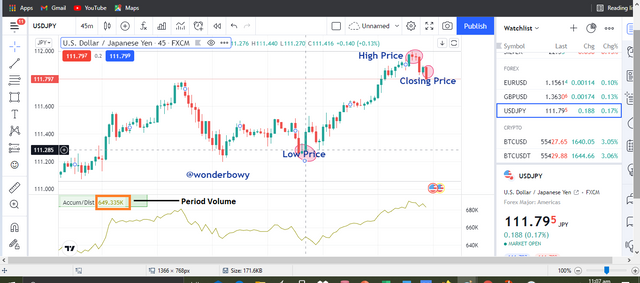
From the above screenshot from trading view chart, we have the following figures;
| PERIOD | FIGURE |
|---|---|
| CLOSING PRICE | 111.788 |
| LOW PRICE | 111.280 |
| HIGH PRICE | 111.928 |
| PERIOD VOLUME | 649.333K |
Therefore, calculating MFM = [( 111.788-111.280) - ( 111.928-111.788)] / (111.928- 111.280)
hence MFM = (0.508-0.140) / 0.648
0.368/0.648 = 0.568
Also, Calculating Money flow Volume;
MFV= Money Flow Multiplier * Period Volume
MFV= 0.568*649.333K
HENCE MFV = 368.821144K
Finally, Calculating A/D;
A/D Previous A/D + Current Period Money Flow Volume
A/D = 649.333K+368.821144K
HENCE A/D = 1,018.15K
4 How is it possible to detect and confirm a trend through the A/D indicator? (Screenshots needed)
There are basically three different ways to detect a trend with the use of this indicator, namely; Uptrend Confirmation, Down Trend and finally through Trend Divergence .
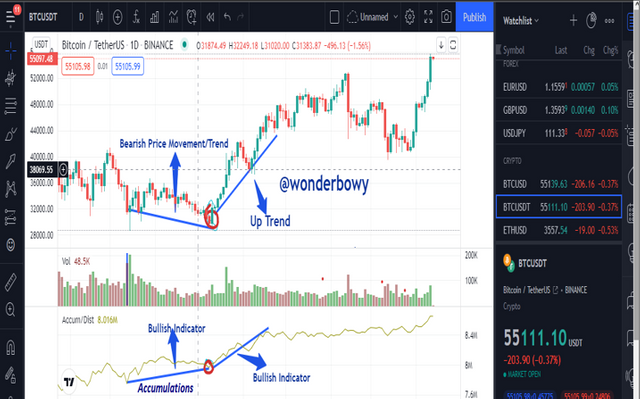
DETECTION AND CONFIRMATION OF AN UP TREND..
This is most likely to occur when there is a higher buy of a particular assert. This will greatly increase the inflow of the assert, thereby increasing the volume accumulations. This great inflow of the volume being accumulated will definitely signal an increase in the price of the assert. As a good trader, nothing that there is more buying activity then selling should signal an uptrend or bullish trend/movement.
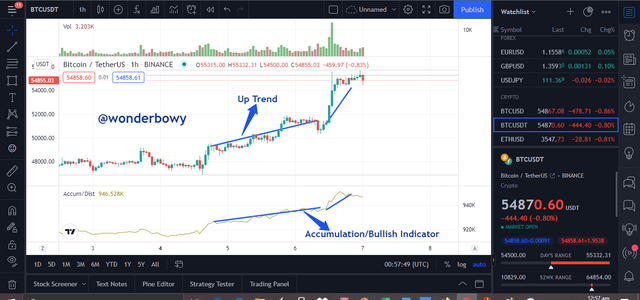
From the chart above, there are two pairs of cryptocurrencies ( BTC/USDT) we can clearly see that both the price trend and the indicator are both on high peak and throughs. In this case we can say that the upward trend is likely to go on for a while. This is means more of the buying is going on as compared to the selling. This is what is referred to as the accumulation, where people hold on to the assert making it to increase in value.
DETECTION AND CONFIRMATION OF A DOWN TREND..
In this case both the market price and the Indicator are on the same down trend through and low peaks. This is referred to as the Distribution, where more of selling takes place than buying. Meaning there is a bearish trend in respective to the A/D indicator. They are both moving in one direction, that is down ward trend and this trend is likely to occur for a while. For that matter it is advisable to make a buy entry during this trend.
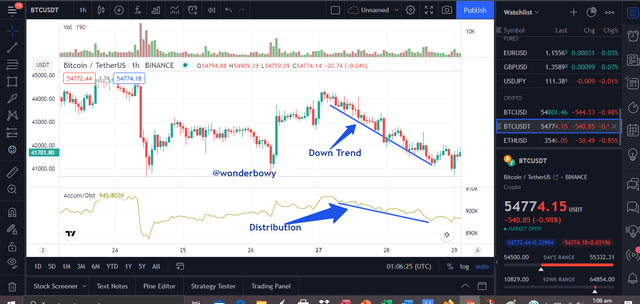
Taking into consideration the two pairs of cryptocurrencies namely BTC and USDT, there is a bearish market movement and a bearish indicator trend as well. This position situation is most preferable good for making a sell exit.
TREND DIVERGENCE
This is where more emphasis are placed on. It is when an Indicator moves in a different direction in respect to the market trend. We take into consideration two basic divergence. One is advisable for making a buy entry whiles the other is meant for a sell or exit. Lest compare the two screenshots below from trading view...
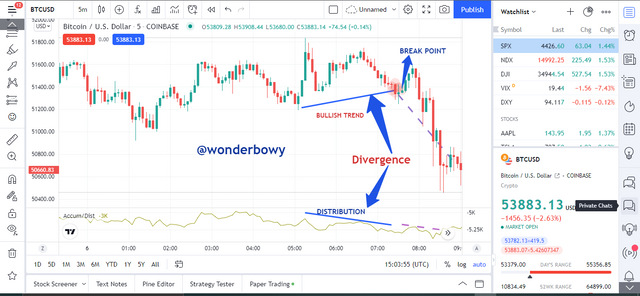
From the screenshot above, we can see clearly that there is a down trend or bearish trend in the market but the A/D Indicator shows an Up trend or Accumulations. There is Bullish Trend of indicator whiles a bearish trend on the market chart.
When this incidence occurs, its is likely that there will be a swift or turn in the market trend after a period of time. This is where it is advisable to make a buy entry as soon as there is a break point.
As we can all see in the above screenshot, there is a break point in the market trend. After that there is an Up Trend of price movement whiles there is an Up Trend of the A/D Indicator.
On the other hand, when we take a look at the screenshot above, there is an Up Trend in the market price whiles that of the A/D Indicators shows something contrary to that. The A/D Indicator shows a Distribution instead of an accumulation.
When this happens there is likely hood of a downtrend in any moment after a Break Point as we can all see in the screenshot above. During this period, its much advisable to make a sell.
5- Through a DEMO account, perform one trading operation (BUY or SELL) using the A/D Indicator only. (Screenshots needed).
Looking at this market, a buy entry will be in favor there going in for a buy entry.
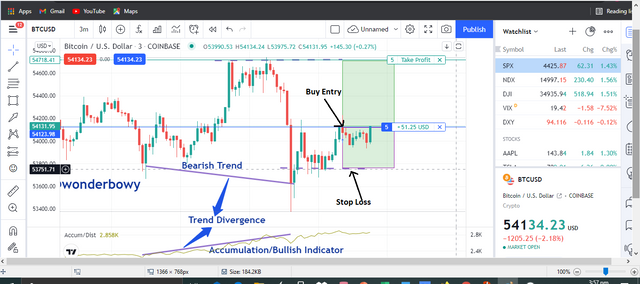
I spotted a divergence where the price of the assert was falling whiles that of the A/D Indicator was raising. In this case, I waited for a while to see a break point in order to enter the market. There was break point but I had to be sure so I waited to see a Strong Bullish Candle to confirm that. I saw the chance to enter the market after that because there was certainly an accumulation of the assert meaning there will be an up trend after some time.
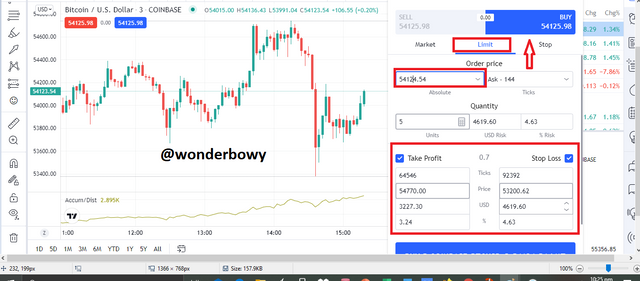
I placed a buy limit order with a Stop Loss just below the entry price. The stop loss at 53200.00 a little closer to our support, and a take profit at 54770.00 a little closer to our resistance level. I had seen a little profit made out of it which I could have just cancelled trade and take profit but my target will be achieved.
6- What other indicator can be used in conjunction with the A/D Indicator. Justify, explain and test. (Screenshots needed).
Using an indicator in conjunction with other indicators is very beneficial and good for disclosing fake signals from the market. The A/D Indicator is a wonderful tool but great when combined with another indicator like Heikin Ashi. This is a special indicator that uses a unique formula calculation of just two period averages unlike other indicators that uses the open, close, low and high periods in its calculations. The Heikin Ashi is able to reduce noise in the market through its two period averages.
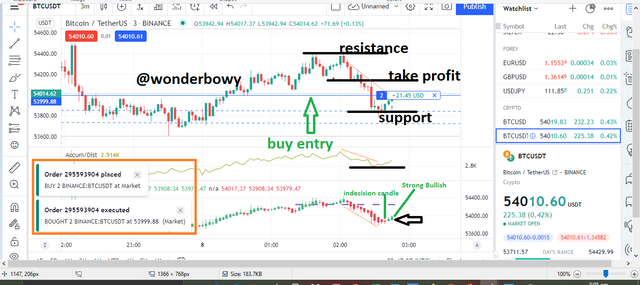
As we can all see from the screenshot above, the Heikin Ashi Indicator together with the A/D indicator are all in a down trend movement.
From the Heikin Ashi, an indecision candle is formed following a strong bullish candle also formed. You can also notice a change in trend of the A/D indicator as well.
It looks like this is profit making entry. I quickly pleased a buy order which actually paid off.
A/D Indicator is a very simple technical indicator to use. It is also very important indicator because it tells the actually buy and sell volume of the market forces in a very simple manners. Thanks to prof @allbert for this weeks lectures. Hope to take part in your upcoming lectures.
Thank You