[Technical Indicators 2] - Crypto Academy / S4W4- Homework Post for professor @reminiscence01
Hello comrades,
Question 1. (a) Explain Leading and Lagging indicators in detail. Also, give examples of each of them. (b) With relevant screenshots from your chart, give a technical explanation of the market reaction on any of the examples given in question 1a. Do this for both leading and lagging indicators.

(a) Explain Leading and Lagging indicators in detail. Also, give examples of each of them.
LEADING INDICATORS; They are simply indicators whose signals are a little bit ahead of the price compared to the current market timeframe. This means they are able to predict the price of the asserts before it actually occurs. Therefore, they are able to measure the change in rate of price actions and quickly predict when the price action slows down or speeds up during a trend. Some of this indicator includes Average Directional Index, Stochastic Oscillator etc.
Having to know what the leading indicators are all about lets take this simple example; lets assume a strong bearish candle is formed and the prices goes low and all of a sudden there is slow movement in trend, the leading indicator can recognize this and then predict a change in movement of a downtrend.
LAGING INDICATORS; This indicators I will say is the exact opposite of the leading indicators. That is, they tell the price trend after the price action has already occurred. They normally delay in giving signals, when the price action has already been established on a chart that is when they also give same signal. They are usually used in the confirmation of price change or trend on a chart.
An example is when the price of an assert drops to $100.00 but after some time before the lagging indicator establishes it on the chart. This was to show how strong the price change was during trend.
Lagging indicators do not have false signals because its just the same action that is being depicted since it’s a copying of the market trend of an assert. Its just following the market trend, that’s why the name lagging indicator. Some examples of the INDICATORS include Exponential Moving Average, Bollinger Bands etc.
Although the lagging indicators do not depict false signals, it does not make any impact towards profit maximization. This is simply because they do not predict price actions rather, they give late signals by then the trader might have made his or her own technical analysis.
b) Explain confluence in cryptocurrency trading. Pick a cryptocurrency pair of your choice and analyze the crypto pair using a confluence of any technical indicator and other technical analysis tools. (Screenshot of your chart is required ).
LEADING INDICATOR;
The stochastic indicator uses overbought and oversold zones to predict market action. In these overbought and oversold zones, a potential trend reversal is expected. For an assert in a bullish trend, when the stochastic indicator shows an overbought signal, we can expect a downtrend or bearish reversal. For an asset in a bearish trend, when the stochastic comes indicator shows an oversold signal, we can expect an uptrend or bullish reversal.
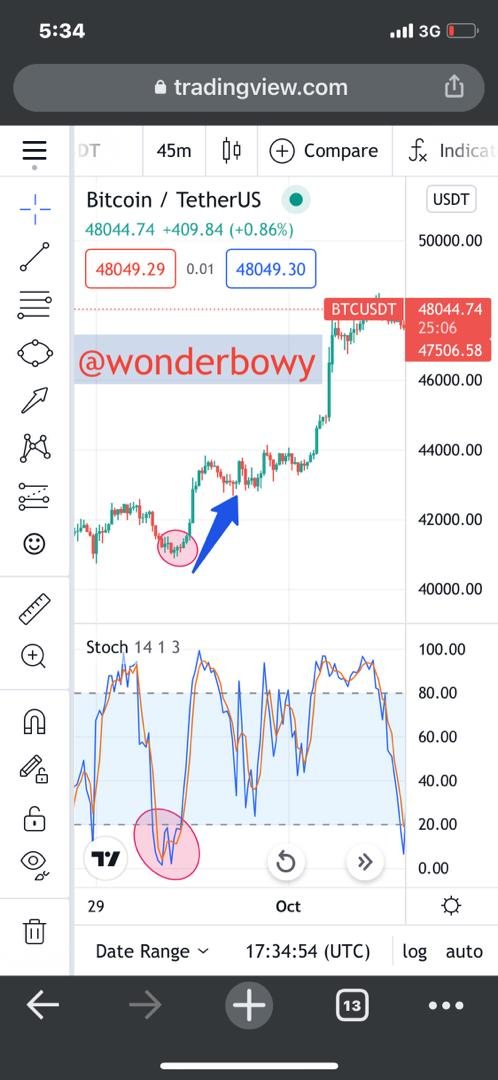
In the 1-hour BTCUSDT chart above, we see how the market trend immediately reverses after the stochastic indicator, which is a leading indicator gives an oversold signal. Oversold and overbought signals of the stochastic indicator implies there is going to be a potential reversal of the trend like we actually see in the screenshot above. Price action agrees with the signal of the stochastic indicator and so there is confluence.
LAGGING INDICATOR;
The EMA is a moving average indicator, hence a lagging indicator that lags behind price. It shows whether the market is bullish or bearish depending on its position relative to the candlesticks. When it is below them, the market is bullish and bearish when it is above them. Being a lagging indicator, the EMA doesn’t respond as quickly to price movement as leading indicators do.
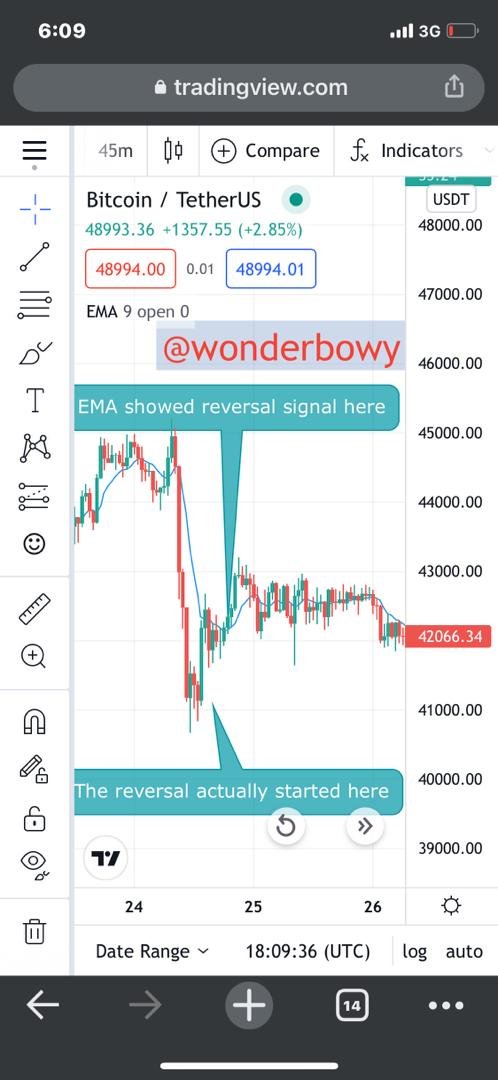
Let’s consider the 45-minute BTCUSDT chart above. We see that the market reversal actually started a little above 4100 but the EMA showed this reversal signal a little above 4200. Traders would’ve missed the opportunity to enter the market early if they relied solely on the EMA
Question 2. (a) What are the factors to consider when using an indicator? (b) Explain confluence in cryptocurrency trading. Pick a cryptocurrency pair of your choice and analyze the crypto pair using a confluence of any technical indicator and other technical analysis tools. (Screenshot of your chart is required ).
(a) What are the factors to consider when using an indicator?
As a good trader there are some factors to consider before making any trading decisions in order to maximize profit. These factors are very necessary in the cryptography world especially in the trading world. Lets take a look at some of them;
- Understanding your Trading Strategy;
Understanding the market trend usually depends on the type of indicator in use, either Leading or Lagging. So, whenever a trader chose a type of indictor, he or she should be very conscious not to be trading in the wrong time frame. For example, a trader using a technical such as Exponential Moving Average as we all know is a lagging indicator. If a trader does not notice this or not aware of this and as a result maybe trading in the past. This is because as we all know lagging indicators gives signals only after the market trend itself is exposed. That is why it is very important to know the type of indicator to use.
- Understand the Market Trend;
Another important factor to consider in trading, especially in the use of technical indicators. As we all know As a good trader there are some factors to consider before making any trading decisions in order to maximize profit. These factors are very necessary in the cryptography world especially in the trading world.
- Understanding your Trading Strategy;
Very important factor to consider as a trader. It is very important to consider this factor as first. Knowing what strategy to use helps you make the best of choices when trading especially when you are picking a technical indicator to use. Which ones to use or combine, how to set them up to suit your trading techniques or style.
- Understand the type of Indicator;
there can only be two market trends which are the trending and ranging. It is very much advisable use the **trend-following indicators in making technical analysis during a trending- market. Likewise, it’s good to employ momentum-based indicators and also volatility-based indicators during a ranging trend.
- Finding Confluences;
Finally, we talk of the confluence which has to do with the ability of a trader to notice similarity between different indicators at the same time. Therefore when two or more indicators show the same or similar trends either in a downtrend or uptrend movement, if the trader is able to spot such trends and make an entry or exit depending on this signals could maximize profit.
(b) Explain confluence in cryptocurrency trading. Pick a cryptocurrency pair of your choice and analyze the crypto pair using a confluence of any technical indicator and other technical analysis tools. (Screenshot of your chart is required ).
CONFLUENCE in cryptocurrencies trading is simply using multiple indicators to confirm a single trend during a trade. In this case there should be an agreement between two or signals to be able to execute a successful trade. Lets take for example the screenshot below;
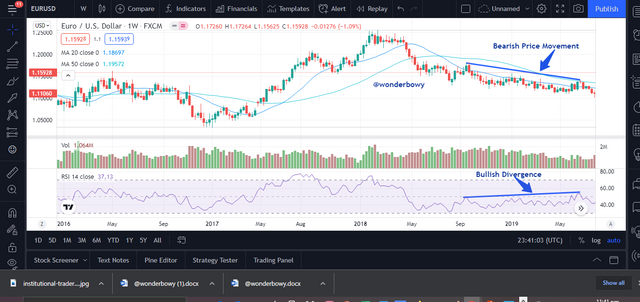
Using two different indicators namely the Moving Average Convergence Divergence (MACD) and RSI, we can demonstrate a possible reversal in the trend, which ofcus when a support or resistance level is spotted.
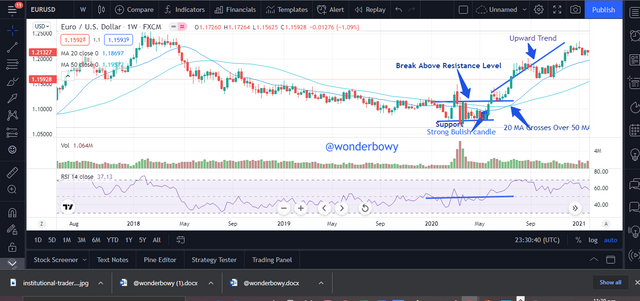
From the diagram above, we have two pairs of cryptocurrencies assets EUR/USD. A support level was drawn and that signaled a possible change of movement. The break of the market structure resulted in an overall shift of market trend from bearish to bullish which is a signal that the market buyers are taking control over the sellers. Also the cross over of the MA 20 over the MA 50 is a signal of a buy entry. Meaning more buyers are in the market.
Question 3. (a) Explain how you can filter false signals from an indicator. (b) Explain your understanding of divergences and how they can help in making a good trading decision. (c) Using relevant screenshots and an indicator of your choice, explain bullish and bearish divergences on any cryptocurrency pair
( a) Explain how you can filter false signals from an indicator.
A trader can filter out false signals by simply combining two or more indicators with the current price actions. This will help form a confluence trading. With this approach, he or she can filter out fake out signals generated. That way one one indicator gives a signal, you check the others to see if it corresponds with them and the market price movement before making any decisions.
(b) Explain your understanding of divergences and how they can help in making a good trading decision.
It’s a trading instance where the indicator in uses tells a different trend movement from the market price movement. Whiles the indicator is in a bullish trend , the chart is in a bearish trend or vice versa.
Divergence occurs in two different forms namely Bullish and Bearish.
(c) Using relevant screenshots and an indicator of your choice, explain bullish and bearish divergences on any cryptocurrency pair
When it comes to trading with the use of indicators, there could be instances where the indicator gives a false signal. Meaning there could be a signal of an uptrend of an assert but the indicator in use could be telling something else likewise there could be a downtrend of a chart whiles the indicator in use could signal an uptrend. This is what we term as a false signal, and it’s our responsibility as good traders to be able to spot these false signals.
This opposite change in trend respective to the indicator in use is termed as DIVERGENCE. There are two mean types of DIVERGENCE namely, the BEARISH DIVERGENCE and THE BULLISH DIVERGENCE**.
When we talk of BEARISH DIVERGENCE,it’s a type of divergence where there is a strong upward trend or movement on the market but the indicator shows an downward trend.
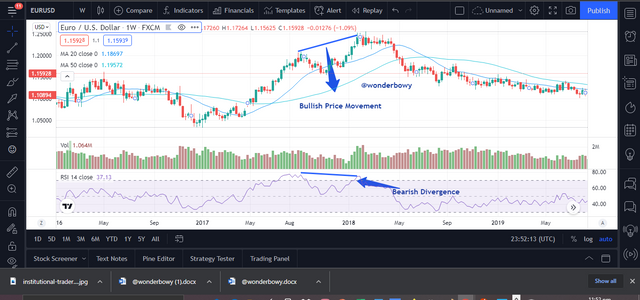
- BULLISH DIVERGENCE;
This is when there is an upward trend in the indicator whiles its show something very different of a down ward trend is spotted on the market.
Technical indicators are very good tools to apply in our trading. It helps in maximize profit and minimize loses, that is if only they are applied well.
Thanks to the steemit crypto academy for this weeks lectures and to our honorable lectures for taing us through each of the class.
Thank You..
Hello @wonderbowy , I’m glad you participated in the 4th week Season 4 of the Beginner’s class at the Steemit Crypto Academy. Your grades in this task are as follows:
Observations:
You have used an irrelevant chart in your work by using a forex chart. This is crypto academy and every study here should be related to crypto academy.
Recommendation / Feedback:
Thank you for submitting your homework task.
Fuck, I didn’t even noticed it🥺.. but at least 5 from you would have been okay😓