Basic Trading Strategy Using The Harmonic pattern AB=CD + Fibonacci | Steemit Crypto Academy | S4W2 | Home Work Post For Professor @lenonmc21

1.Define in your own words what Harmonic Trading is?
When we talk of HARMONIC TRADING, it is simply a trading technique which is associated with the Fibonacci numbers. It is a complex pattern in the forex trading that uses the Fibonacci numbers to define accurate trading points. It helps in high-level accuracy in the forex trading with a unique reversal pattern. It usually depends on the B point which defines the pattern of the other structures. It helps defines the trading pattern of what will happen next in the forex trading. Its creates a swing high and swing low pattern as well.
Butterfly Harmonic Pattern; it is a reversal pattern which is composed of four legs with a swig high and swings low. The points are interconnected which looks like a butterfly.
pattern to predict which has been of great benefits to most traders yelling much more profits.
2.Define and explain what the AB=CD pattern is and how can we identify it?
Define and explain what the AB=CD pattern
The Harmonic AB=CD is a unique pattern which was discovered by H.M GARTLEY who happens to be of the greatest predecessors of technical and fundamental analysis. The pattern originated from 4 movements which is commonly known as the A,B,C and D movement. This movement was based on the concept of price repetition. This means a price of an assert is likely to repeat itself along the line during a trade. Which implies to the Harmonic Trading as said earlier on in question 1. This repetition movement gives the trader the insight of watching out for the same price movement on a chart. This is when the AB=CD pattern need to be critically analyzed to be able to detect potential trading entries and exist on a chart. In addition, this pattern alone does not yield much profit alone so for a trader to make the most out of the market, he or she needs to combine with our indicators.
How can we identify the AB=CD pattern..
Identifying this pattern needs series of critical analysis. We can generally identify it in two ways, that is theough the AB=CD Bullish and AB=CD Bearish. Lets take a look at them one after the other.
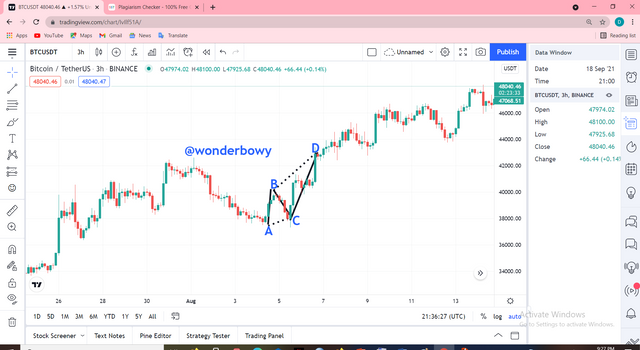
AB=CD BULLISH; In order to identify this movement and any upcoming bullish movement after, there must be a dip or fall in price first. Making room for us to identify the four points when there is a reversal. Example of the four points A,B,C, AND D are displaced on the screenshot above.
Now that we have identified the four points that are decreasing in conjunction with price, let’s use the Fibonacci Retracements to verify if it’s valid or not. It is necessary because it’s part of the criteria to make buying or selling entries on the market.
With the help of screen shots, the criteria are as follow;
- There shouldn’t be any secondary movements that exceeds the points A and B.
- Point A must always be greater than Point C. In addition, point C must be between the percentage rates of 61.8 to 78.6 of the Fibonacci Retracements of The AB movements.
- Finally, point D must always be between 127.2% and 161.8% of Fibonacci Retracements, of the movement between BC.
Now lets take a look at the next thing which is;
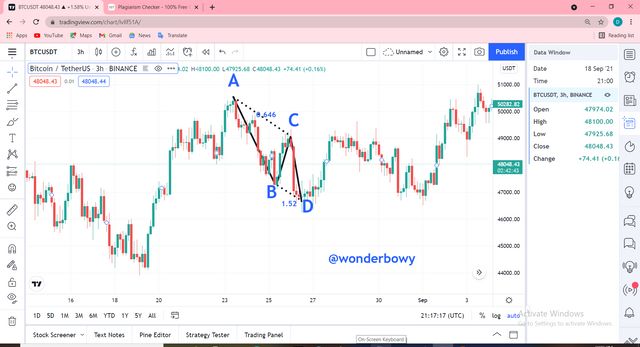
AB=CD Bearish; Unlike the AB=CD Bullish in which there is a need for price decrease, the price must be rising when it comes to the AB=CD bearish. Meaning in order to get our four points, there must be a current bullish movement. This is disclosed in the above screenshot as we can all see. This is done with the same procedures listed earlier but this time round it will be done in the vice versa. With the use of the Fibonacci Retracement, let us verify if the four points are valid.
- There shouldn’t be any secondary movements exceeding the points A and B in motion.
- Point C must be higher than the points A and B. It must also be between a percentage rate of 61.8 and 78.6 of the Fibonacci Retracements of the AB line.
- The Point “D” must always be between the percentage rate of 127.2 and 161.8 of the Fibonacci Retracements of the movement along line BC.
3.Clearly describe the entry and exit criteria for both buying and selling using the AB=CD pattern?
When it comes to making an entry in an AB=CD pattern entry and exit for both buy and sell order, we can talk of the BULLISH ENTRY and EXIT as well as the BEARISH ENTRY AND EXIT.
AB=CD BULLISH ENTRY AND EXIT
If there is a downtrend in relation to A,B,C and D and that D happens to fall between a percentage rate of 127.2 and 161.8 of the Fibonacci Retracements, the next thing we do is to wait until a bullish candle is formed and as soon as it is formed, we make a buy entry. It is also good to wait until the price of the security exceeds the B point in order to stay in the safe zone.
When it comes to making an exit approach in the AB-CD Bullish pattern, we focus on the C Point, which is less risky. In this case, we use the D point as a STOP LOSS.
AB=CD BEARISH CRITERIA (BUY AND SELL)
If there is an Up Trend in relation to points A, B, C and D and that point D is between the percentage rate of 127.2 and 161.8 of the Fibonacci Retracements, then the next thing to do is wait for a bearish candle to be formed the we make the move to enter a sell order. You can also decide to stay on the safer side by waiting for the B point price to be broken.
Practice (Only Use of own images)
Make 2 entries (Up and Down) on any cryptocurrency pair using the AB=CD pattern confirming it with Fibonacci.
Lets start with the buy order.
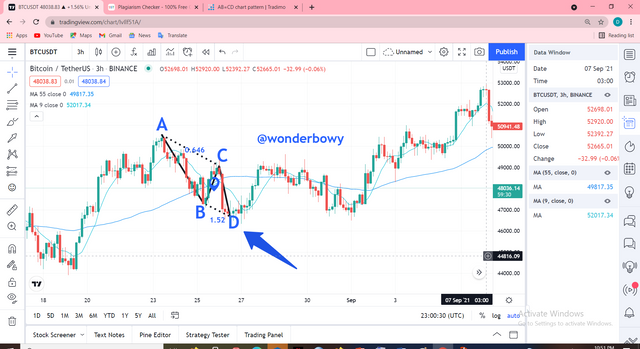
From the start of the lesson, we got the idea of how the harmonic pattern ABCD works in buying assets. There is a need for the assert to be in a downtrend. As we can see from the chart I sported a down trend, and made my move.
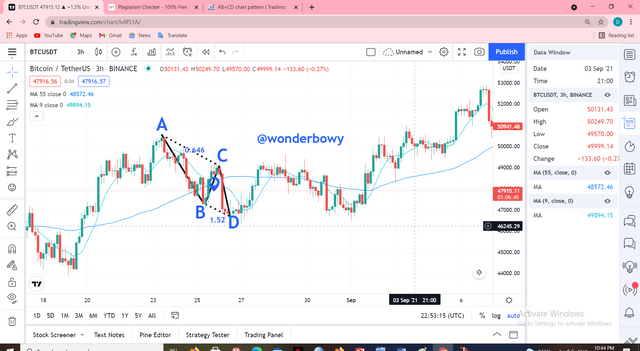
Since the points we are looking for are formed, the next step is to confirm if the pattern is valid or not with the Fibonacci Retracement. So I quickly confirmed if the percentage rate is in line.
We then check the Retracement of D which is supposed to be between 127.2 AND 161.8% of BC.
Now that everything is accurate , we only need to set the buy order at the very end of D, which is when our bullish trend or candle or form. Our stop lose was also set below D and take profit too was place above the entry.
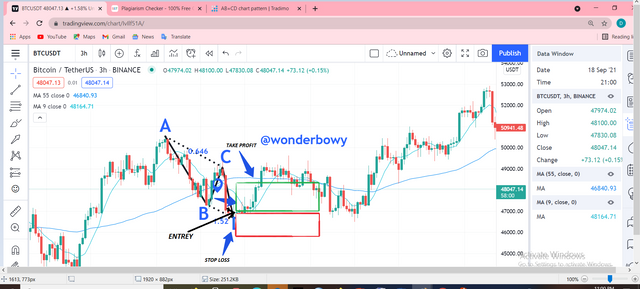
Looking at this, the buy entry can now be executed. Take profit was successful and I am happy with it.
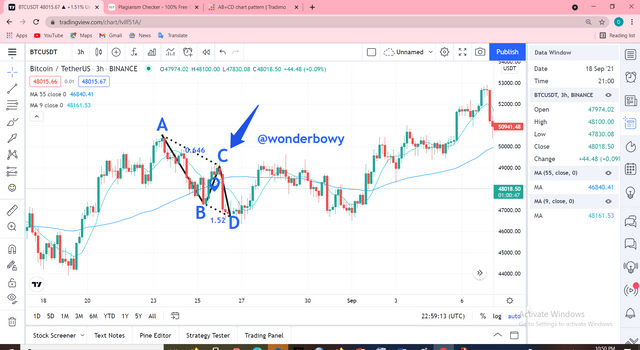
Now to the selling;
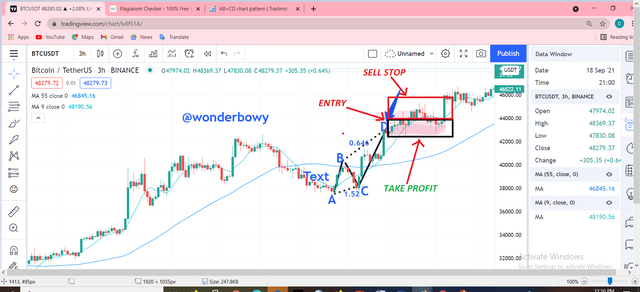
Using the procedure above but in a reciprocal manner, we quickly conform the validity of the Fibonacci Retracement, we then sell our order.
As we can see sell order executed successfully.
Thanks to the steemit crypto academy for this weeks lectures, I have learnt a lot from almost the professors and have attempted most of their home tasks. Not forgetting our own honorable prof @lenonmc21 for taking us through this amazing lectures.
Thank You..