Heikin-Ashi Trading Strategy | Steemit Crypto Academy | S4W2 | Home Work Post For @reddileep
Hello comrades,
1 Define Heikin-Ashi Technique in your own words.
The Heikin – Ashi trading technique is a candlestick technique for trading which was developed by a typical Japanese named Munehisa Homma in the 1700s this was to help traders trade in a unique way. The Heikin-Ashi is a Japanese word which means AVERAGE and the word Ashi means BAR therefore the two words combined means AVERAGE BAR. It uses the average price of a commodity resonating from a trading technique. It uses just two period moving average based on a modified formula to calculate the buying or selling point unlike the traditional technique which focus on 4 different periods namely the open, low, high, and close. It is very easy and smoother in spotting trends and reversals when this technique is employed in trading.
2- Make your own research and differentiate between the traditional candlestick chart and the Heikin-Ashi chart. (Screenshots required from both chart patterns)
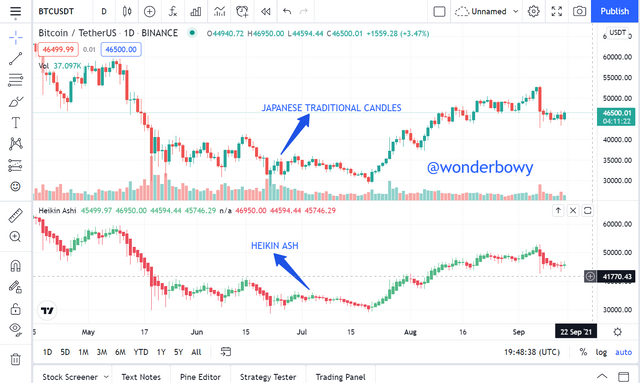
| TRADITIONAL JAPANESE CANDLES | HEIKIN ASH |
|---|---|
| Frequently change from green to red | Only changes when there is a clear market indication of an uptrend or down trend. |
| Interpretation of the traditional candle is very complicated | Smooth looking graph when it comes to the Heikin Ashi |
| Starts at the level where the previous candle closes or opens | They are created based on calculations |
| It involves very short run of green candles and short run of red candles | Long run of red candles and long run of green candles. |
| Very difficult to predict the market | Easy identification of market trends |
| Traditional Japanese candlesticks gives alternate color even if the price is moving dominantly in one direction | Tendency for the candles to stay red during a downtrend and green during an uptrend with Heikin-Ashi. |
3- Explain the Heikin-Ashi Formula. (In addition to simply stating the formula, you should provide a clear explanation about the calculation)
As we all know candles sticks are for tracking the financial flow an assert on the market. That is when financial and technical analysis are required to make the right choices. There are various indicators out there but with the Heikin Ashi candle, it involves a special calculation. Lets take a look at how to go about this calculations with the use of the Heikin Ashi Formula;
- Basically there are 4 ways of calculating the Heikin Ashi formula and they are ; OPEN, HIGH, LOW, CLOSE…
- OPEN IS GIVEN BY;
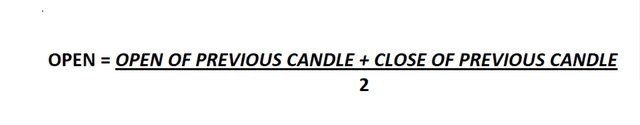
With the formula above, we can see clearly that in order to calculate the OPEN, we need to add the previous open of the candle and the close of the previous candle and divide everything by two(2).
- THE HIGH IS GIVEN BY;
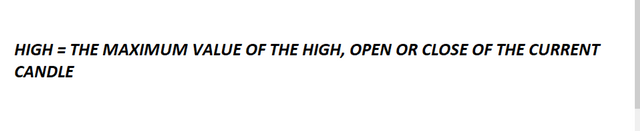
With the above formula, it means the high is simply calculated by taking into consideration the maximum of the high of the current bar, the current Heikin Ashi Open and the current Heikin Ashi Close.
- THE LOW IS GIVEN BY;
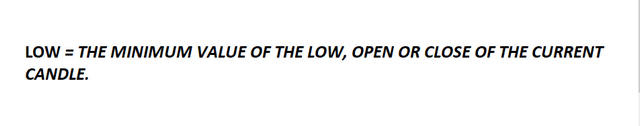
With the given formula above for calculating the low, we can see clearly that it is the minimum of the low of the current bar, the current Heiken Ashi Open and the current Heiken Ashi Close.
- THE CLOSE IS GIVEN BY;
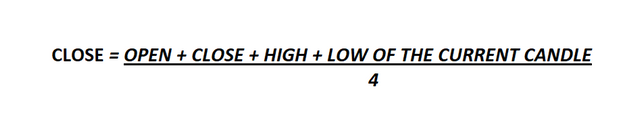
Finally, we are looking at the close, and from the above we can see clearly that the Close is calculated as the average of the open plus close plus high and low of the current bar all divided by 4.
All the above are formulae for calculating the Heikin Ashi.
4. Graphically explain trends and buying opportunities through Heikin-Ashi Candles. (Screenshots required)
Before I take you through the process of using a Heikin Ashi for your trading, lets first see how we can set it up in our charts. I will be demonstrating using the trading view. Let take a look at how to go about it.
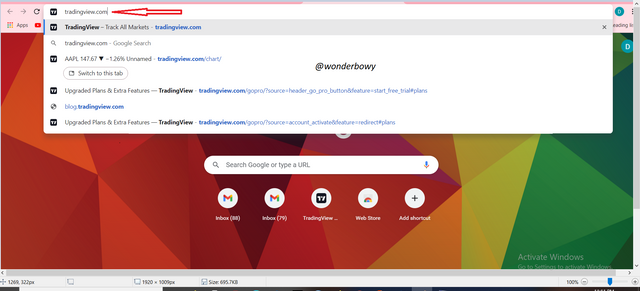
- STEP 1. In case you have an account with trading view already, just log in with your user credentials (USERNAME and PASSWORD). But if you don’t have an account, just visit www.tradingview.com on your browser and click enter.
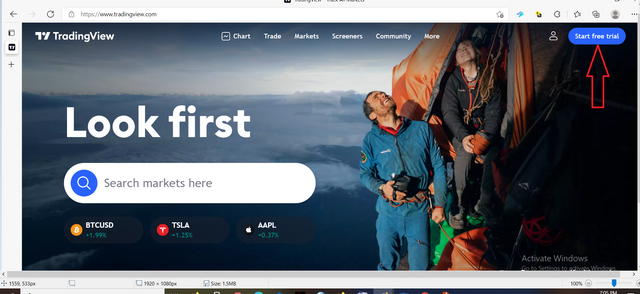
- Click on Start Free Trial
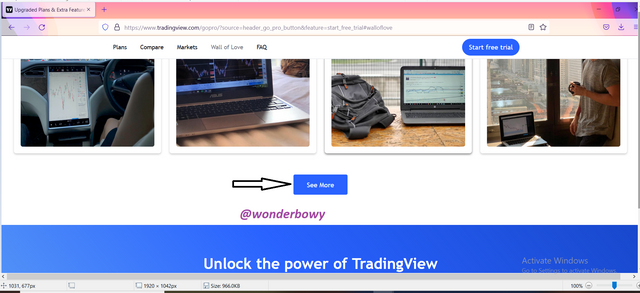
- STEP 2. Scroll to the bottom and Click on Sign Up to get started with your registration.
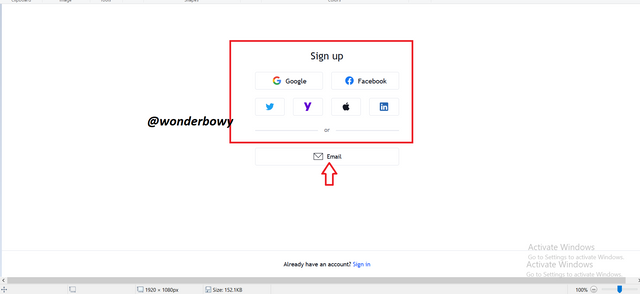
- STEP 3. After clicking on sign up, the next page demands what means you wish to register with. It could be through yahoo,google,Facebook, twitter, apple ID, linked In, or email which I normally prefer.
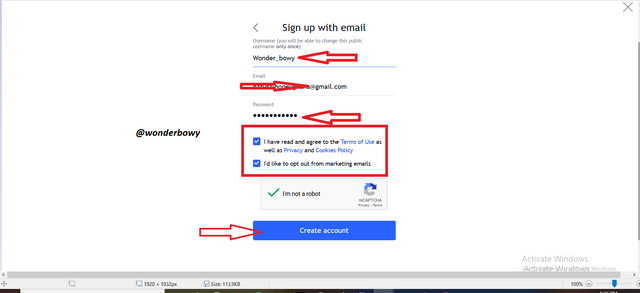
- STEP 4. Enter your user name, password, email, and agree to the terms of service then finally click on create account.
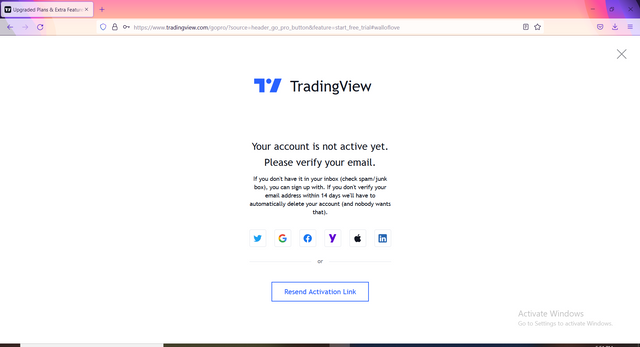
- Log into your gmail and click on ACTIVATE ACCOUNT TO get started, then log into your trading view account with your user name and password.
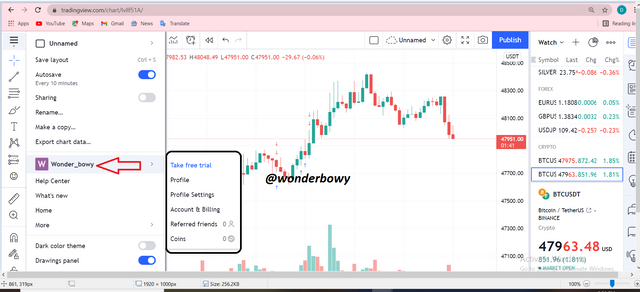
- Account is finally set for use, you can edit your account in settings.
Now that account is finally set for use, the next thing is how to set up the Heikin Ashi on our chart. I will be demonstrating with two ways or methods on how to add Heikin Ashi to our trading chart.
METHOD 1
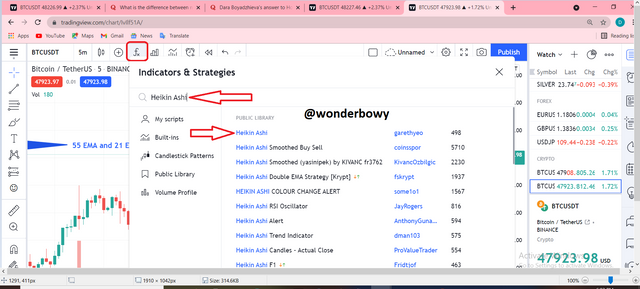
- STEP 1. Click on the fx symbol and then enter Keikin Ashi in the search box. As it pops up among the list of Indicators, click on it to add to chart.
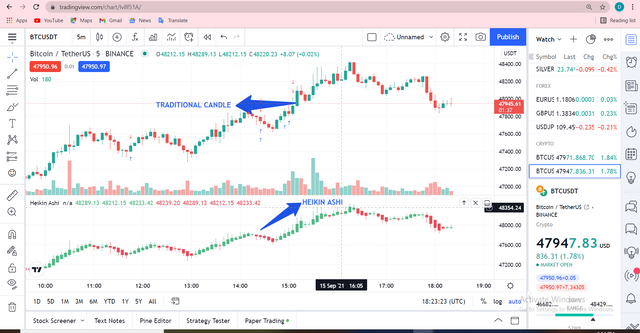
- Heikin Ashi added to chart successfully, Here we have two different indicators on the same chart (TRADITIONAL AND HEIKIN ASHI).
Now lets take a look at the second method....
METHOD 2.
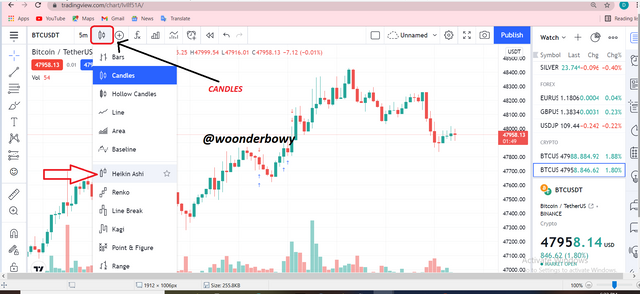
- With the method 2, you click on CANDLES and then within the list of candles choose Heikin Ashi to change the whole candle Heikin Ashi.
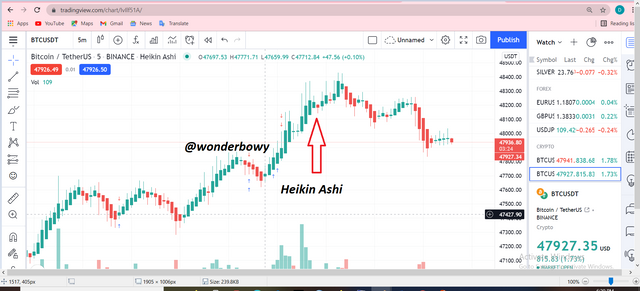
- Traditional Candle changed into Heikin Ashi completely.
Note;
The difeernce between the two methods is that with the first, you have two candles at your disposal on one chart ( BOTH TRADITIONAL and HEIKIN ASHI). This gives the trader the chance to compare the two candles on just one screen but with the method 2 we have only the HEIKIN ASHI on our chart.
Mind you the HEIKIN ASHI on both methods are the same.
Finally lets Lets take a look at how we can we can spot both BUY and SELL entries using the Heikin Ashi.
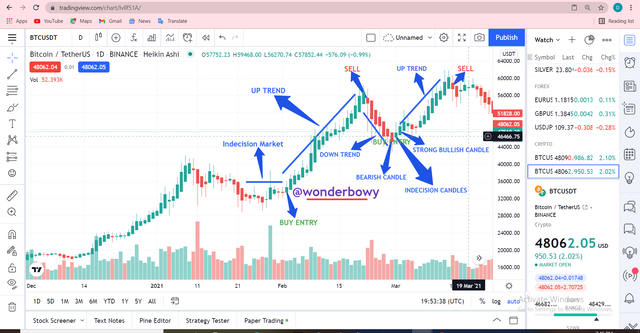
- From the chart above, we can spots various trends, namely the Indecision trend, the up trends and the down trends. From the above screen shots, we can see that from an indecision trend comes either a strong bullish or strong bearish. When you notice this the next thing to expect is either an up trend or down trend movement.The type of movement depends on either a strong Bullish or Bearish.
For a down trend to occur it requires a strong bearish and vice versa. So from the screenshot above, There was a buy order after a strong bullish has taken place after the Indecision Candle. We quickly place a buy order. Also when the candle has reached a resistance level, there is a Bearish Candle after an Indecision Candle has been formed. To be on the safer side, it is advisable to place a sell order.
5- Is it possible to transact only with signals received using the Heikin-Ashi Technique? Explain the reasons for your answer.
Yes, it is very much possible to use just the Heikin Ashi Indicator alone for trading. This is because it is very simple and clear to use. Looking at the advantages listed in above in question 2, we can see clearly that the Heikin Ahi is a very powerful indicator. It is less complicated to use and most importantly it filters a lot of noise within a chart. This prevent force indications that can lead to unecessary loses.
6- By using a Demo account, perform both Buy and Sell orders using Heikin-Ashi+ 55 EMA+21 EMA.
- Before we go into trading on the trading view with the help of 55 EMA and 21 EMA, lets take a look at how we can set it up on our chart.
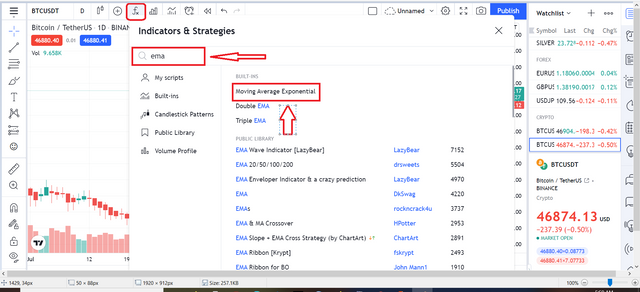
- STEP 1. Click on the fx symbol and then click on the search box and type EMA, finally click on the **MOVING AVERAGE EXPONENTIAL **. Double click o it since we will be using two of them for the demo trading( 55 EMA and 21 EMA.)
- STEP 2. Now it has been added successfully.
- STEP 3. To change the first Moving Average Exponential to 55 EMA we click on the setting button.
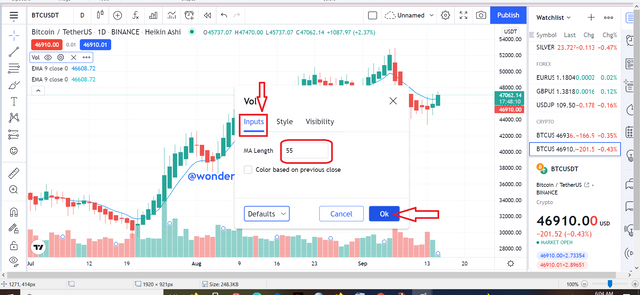
STEP 4. From INPUT, we change MA length to 55 and then click on OK. We apply the same procedure to the second MA and change to it 21 and click on OK.
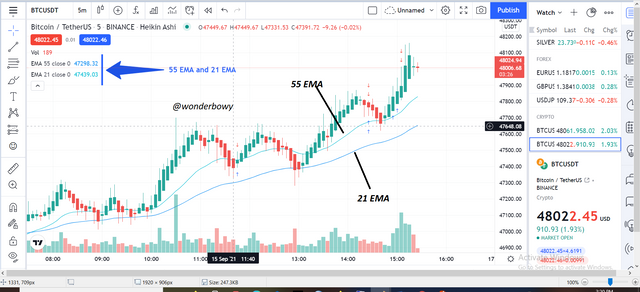
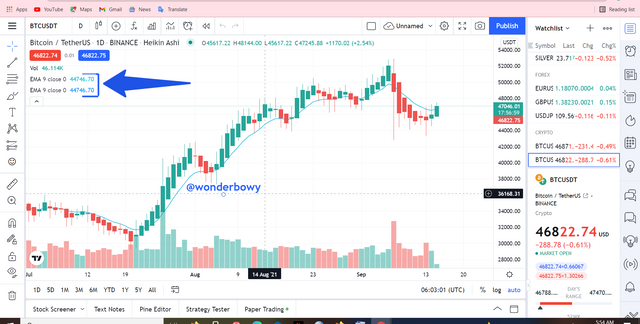
- Both EMAs changed successfully as seen in the above screenshot.
- From the screenshot above we can see clearly that, as the Heikin Ashi reached a resistance level, there was an Indecision Candle. Then the EMA 55 AND EMA 21 formed an interchange or cross. This is a sign of change in trend of the chart.
Finally lets look at how we can place the orders(BUY and SELL).......
BUYING
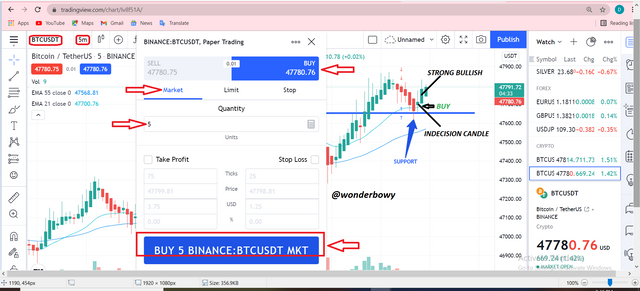
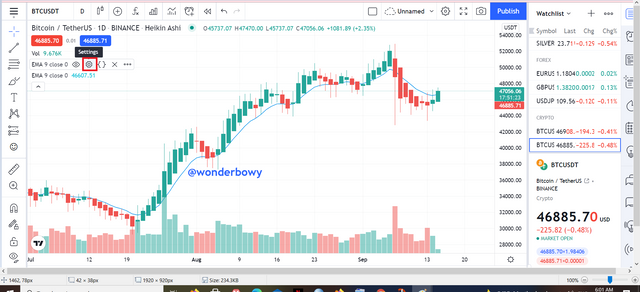
- From the diagram above, we can see a change in trend will soon take place. The support level is therefore drawn. The **INDECISION CANDLE is activated following a STRONG BULLISH CANDLE. This a good time to buy the security as seen in the below screenshot.
- I quickly executed my trade in hope of an up trend. Which you can see occurred some few minutes of buying the dip. At this point I have made enough profit, I can decide to take profit or wait for an indication of a downtrend.
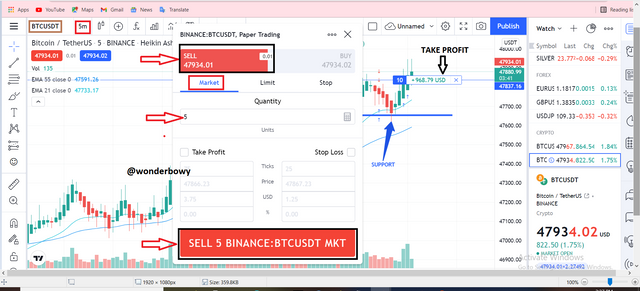
SELLING
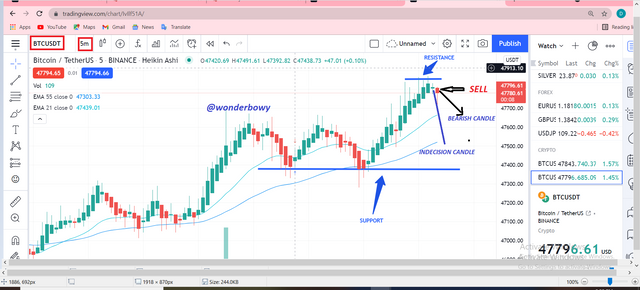
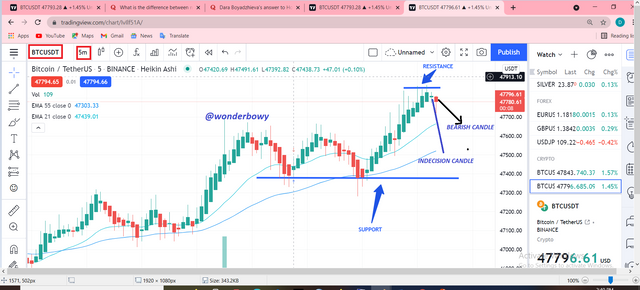
- From the screenshot above, we can see clearly that the Heikin Ashi Candle has reached a Resistance level. This is indicated by the INDECISION CANDLE and followed by a strong BEARISH CANDLE indicating a down trend any moment. To be on the safer side, its advisable to sell at this point to avoid loses. At this point we take profit.
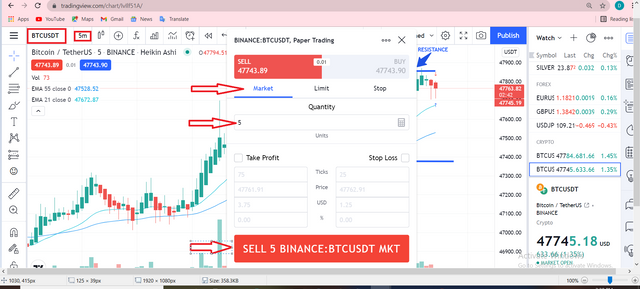
- Selling of security executed successfully...
The Heikin Ashi Technique is one unique indicator to use. It is very simple and easy to use. Most importantly, It can be used alone without having to combine with other indicators. Just that it has a little more advantage combining with other indicators. I can say its okay with me using only the Heikin Ashi for trading.
A very big thanks to cryptoacademy for this weeks lectures and to our honorable prof @reddileep for such a nice and memorable class.
THANKS