Have Cryptos Bottomed?

I haven't been back in a while. Honestly, though I do well trading markets both directions, this bear market has gotten to me mentally, and I decided to hunker down and keep life simple, just posting on Elliott Wave Trader.
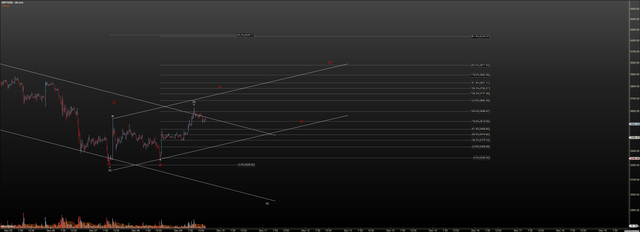
$4600-$4800 was my ideal support for the bull market per all past posts since February, and we pushed straight through that level shortly after the November 13th breakdown. I was very bearish on November 13th per my posts, but I did expect the above region to hold. We are now closing in on $3000 which for me is long term support in the long term count I keep as primary. And, unfortunately, we might be trying to bottom here, but the price action so far is not reliable for a bottom. In fact, I have one foot in on my alternate count, which can go below $3000, and will likely only see a B wave rally, which can takes us back to 5 digits before finally resting in the $1600 zone some time next year, or 2020. Truly the charts have much carnage.
Locally I am tracking two patterns here. The white count has not bottomed locally and will take us down to white 5 which part of an ending diagonal. The red count has the local bottom in and is tracing a diagonal upward in red. The issue is we are moving in non impulsive structure in both directions so I have no edge until one or the other completes. Ether count suggest a bottom soon. However, whether it is the larger bottom to this bear market, or a large B wave rally, remains to be seen.
.png)
Note that free 15 day trials are available for our trading room and community on Elliott Wave Trader, where I am a full time analyst. You'll rub noses with professional, amateur and traders in the learning process, while getting trade calls and ongoing direction for the market. No credit card is needed for a trial.
Note none of my work including the larger body of work for subscribers is intended to be a trade recommendation a I do not know your financial means, or risk tolerance. These are valid setups that can provide return, if using tight risk management with stops.
Crypto is a long way from a bottom
what are the profit projections on the top ten crypto currencies please ?
Think a wave 4 has never retraced so deep before in Ethereum. Any chance that this is a wave 2? Long term counts are still difficult as there is not enough historic reference.
Yes I've moved it to a wave 2. It's a count with problems though
Sounds good. So assuming there's no B(*tch)-wave we will get an emotional wave 3 or another large nested 1-2 pattern. I'm guessing the 6900$ target is a distant dream for now.
B(*tch) wave LOL. I call them 'B is for Bastard' LOL
Nice. It would correspond very well to the term Bit(ch)coin if that happens.
Hi @wildtrader!
Your post was upvoted by @steem-ua, new Steem dApp, using UserAuthority for algorithmic post curation!
Your UA account score is currently 3.406 which ranks you at #7002 across all Steem accounts.
Your rank has dropped 26 places in the last three days (old rank 6976).
In our last Algorithmic Curation Round, consisting of 226 contributions, your post is ranked at #200.
Evaluation of your UA score:
Feel free to join our @steem-ua Discord server
Hey man, glad to see you back. I gotta tell you I took out the 15 day trial on EWT and it is awesome. I am not blowing smoke here. Pretty much took me off steemit completely while my trial was on. Unfortunately it ran out and I need the crypto profits to start rolling in again to fund my future membership 🤑
Anyway, while I was there, someone linked the TradingView scripts for log fibs and I tried them out (don’t worry, i wouldn’t post them publicly). I am interested in GRS, and when I searched for it on EWT there was not a recent analysis. I was hoping you might check this out and maybe give me some feedback like I am on the right track or off completely. Note that I have taken to manually adding the fib lines so they don’t disappear when I move to another chart. This looks like pretty solid “low pinball” to me though, completing circled iv either as an abc or a longer triangle targeting the range between the 0.382 retrace or circled iii and the 0.764 extension of circled i, before (hopefully) heading up to $25-120. Appreciate your thoughts.
https://www.tradingview.com/x/hEFj41K7/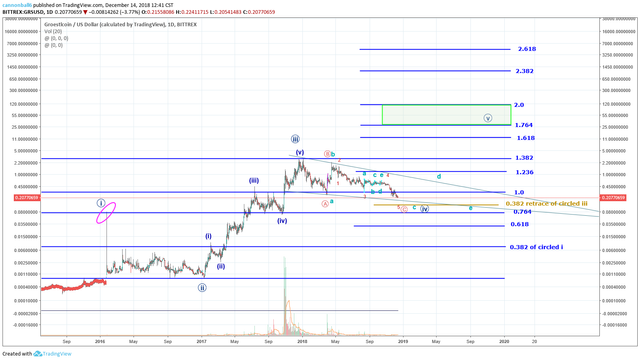
Looks pretty good from here I'll put a note to post it on the site, if you are still on. I'm busy this weekend, but usually am on Sunday nights for the nightly report and knocking the request list down. I'll put this in the system to remind me.
I posted my view. A little different from you, but I have yours as a solid alt.