Crypto Academy / Season 3 / Week 6 - Homework Post for Professor @cryptokraze - Topic: Trading Liquidity Levels The Right Way.
Hello everyone, welcome to week 6 of Crypto academy's season 3. In today's lecture, professor @cryptokraze while teaching on the topic "Trading Liquidity Levels The Right Way" explained to us the concept of liquidity levels, fakeouts and how to avoid fakeouts. Below is my response to the assignment he gave after the class.
Question 1: WHAT IS YOUR UNDERSTANDING OF THE LIQUIDITY LEVEL. GIVE EXAMPLES
In the world of finance trading, the term Liquidity implies the speed at which a given asset is been bought or sold in the market. This asset can be a stock, cryptocurrency e.t.c. Liquidity gives us a clue of how large the volume of an asset is currently in the market. If the volume of an asset is much, orders are filled more faster (high liquidity), but if the volume of an asset is very low, orders are filled slower (low liquidity).
Based on this, we can define Liquidity levels as those specific areas in the trade chart where there is a sharp increase or decrease in the value of an asset in a price chart. This sharp movement in the price of the asset is as a result of the reaction of the market to the pending orders, and also the levels where the traders set their take-profit and stoploss.
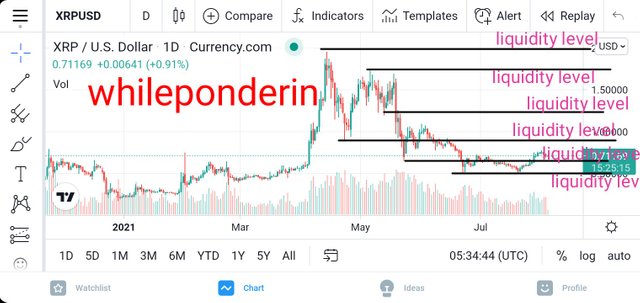
Due to the fear of losing their investment brokers, hedge fund firms and other institutional investors normally manipulate the market when the price of the asset is about to get to the liquidity level. This way, they prevent lots of traders who already have pending orders, stoploss and take-profit at that point from cashing in at those areas. Below is an example illustrating liquidity levels.
Looking at XRPUSD chart above, you will notice that the areas indicated as liquidity levels show sharp reactions in prices. These prices are quickly rejected because of the manipulation of the value of the asset by brokers and other large investors. These investors make lots of money by luring small scale investors into making wrong decisions based on the decieving movement of the market. This situation in trading is referred to as Fakeout.
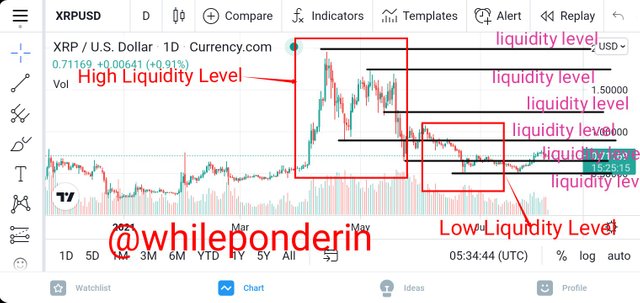
Based on the volume of the asset traded within a specific region, there are two types of Liquidity Levels. They are the High liquidity Level and Low liquidity Level. High Liquidity Levels are characterized by large-bodied candlesticks (which implies that a large volume of the asset are traded in that area). On the other hand Low liquidity levels are characterized by small-bodied candlesticks (which implies that a small volume of the asset is traded within the area). The screenshot below shows the High and low liquidity levels in the XRPUSD chart used in the example above.
Question 2: EXPLAIN THE REASONS WHY TRADERS GOT TRAPPED IN FAKEOUTS. PROVIDE AT LEAST 2 CHARTS SHOWING CLEAR FAKEOUT
In finance trading, the term Fakeout is used to described the situation that occurs when traders make wrong trading decision based on the price movement of an asset manipulated by brokers and other institutional investors. Fakeouts normally occur around liquidity levels.
What happens during a fakeout is this; when an asset gets to its liquidity level (meaning that the price movement is considerably sharp as a result of the action of buyers and sellers), institutional or large investors manipulates the price movement of the asset by opening a trade around that liquidity level. Since these institutions have high investment power, the market is highly influenced by their order thus moving the market in the direction they intend the market to go.
Small scale crypto investors who notice the sharp movement of the asset will assume that the market will continue to move in that direction, thus they immediately join the trade, therefore creating more liquidity in that direction of the market. As soon as the institutional investors observe that the market has accumulated enough liquidity, they quickly close down their trade in that direction and then open another trade in the opposite direction.
Due to the fact they have a high investment volume, they cause the market to reverse once more to the direction they want. This way, all those trader who believed in the first movement of the market will realize they have made a wrong investment decision as the market soon begins to go against them.
I will be using two crypto assets to explain Fakeout
Asset 1: BTC/USD 4 Hour Chart
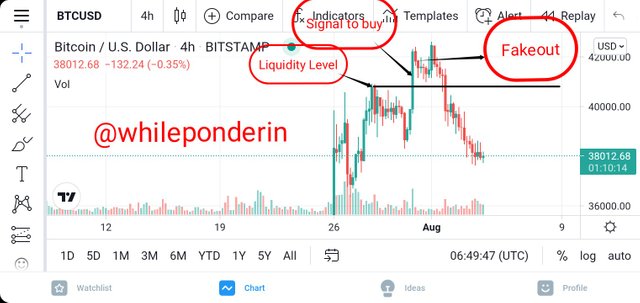
From the BTCUSD chart shown above, you will notice that as soon as the price of the asset approached liquidity level, the institutional investors opened a buy trade order further creating a bullish movement of the asset's price. This upward movement attracted the interest of small scale crypto traders who believe that the market will continue going in that direction, therefore they opened a buy trade too. The joining of the small traders further created much liquidity of the asset.
As soon as the institutional investors noticed that enough liquidity have been accumulated in the asset, they closed down their buy order and created a sell order. Due to the fact they have high asset volume, their sell order affects the market considerably causing a sharp decline in the price of BTC, and thus, hitting and crossing the stoploss the small investors have set in their buy trade.
Asset 2: LTC/USD 4 Hour Chart
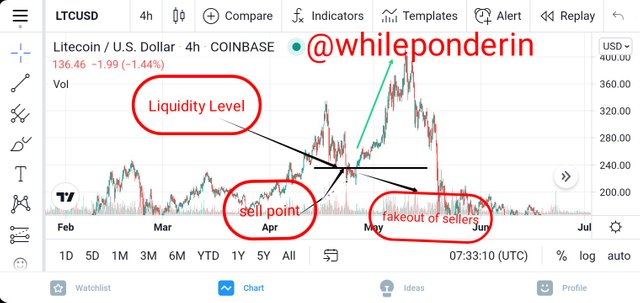
From the LTCUSD chart shown above, you will notice that as soon as the price of the asset approached liquidity level, the institutional investors opened a sell trade order further creating a bearish movement of the asset's price. This further downward movement attracted the interest of small scale crypto traders who believe that the market will continue going in that direction, therefore they opened a sell trade too. The joining of the small traders further created much liquidity of the asset.
As soon as the institutional investors noticed that enough liquidity have been accumulated in the asset, they closed down their sell order and created a buy order. Due to the fact they have high asset volume, their buy order affects the market considerably causing a sharp increase in the price of LTC, and thus, hitting and crossing the stoploss the small investors have set in their sell trade.
Question 3: HOW YOU CAN TRADE THE LIQUIDITY LEVELS THE RIGHT WAY? WRITE THE TRADE CRITERIA FOR LIQUIDITY LEVELS TRADING
For a trader to be able to trade liquidity levels, he must have a carefully drafted trading strategy that will enable him to notice a trade opportunity from the beginning, even before it is confirmed. Some of the strategies that can be used in trading liquidity levels include Break Retest Break (BRB), and Market Structure Break (MSB). Also indicators like the moving averages can be used too. Let me illustrate how to use some of these strategies.
1. MARKET STRUCTURE BREAK (MSB) STRATEGY.
Market Structure Break is one of the strategies that can be used in reading liquidity. Below are some of the rules to follow if you wish to use MSB strategy to trade liquidity levels.
To enter a liquidity trade using the MSB strategy, you must make sure the following elements are present.
a. There must be a trend structure
The asset's price movement must be moving in an uptrend or in a downtrend. Thus, there must be a clear indication of high and low points of the trend.
b. Confirmation of Trade
Don't rush into the trade, rather wait for the price of the asset to cross the liquidity level, thus breaking the market structure either in the upwards or downwards movement.
When the break has occurred, wait for the price of the asset to close above the previous lower high (in the case of an uptrend), or close below the previous higher low (in the case of a downtrend).
c. Execute Trade
After the trade has closed above or below the previous swing point as the case may be, execute the trade order.
Below are screenshots showing a Buy situation using MSB.
To exit a trade using the MSB strategy, you need to set the points where you want to take profit or stoploss. Setting the stoploss will cause the trade to stop automatically if the market begins to move against you. The take profit helps you to secure your gain when the market gets to a point in the direction you predicted. This is to prevent you from losing all you gained when the market starts to reverse.
It's best to set the ratio of take-profits and stop loss to a minimum of 1:1. This way you don't risk more than you hope to gain.
2. USING BREAK RETEST BREAK (BRB)
Break Retest Break is one of the strategies that can be used in reading liquidity. Below are some of the rules to follow if you wish to use BRB strategy to trade liquidity levels.
To enter a liquidity trade using the BRB strategy, you must make sure the following elements are present.
a. Check for Break Retest Break Structure
Before the Break Retest Break Strategy can be used to enter a liquidity trade, a break retest break structure most be present in the chart. Break retest break structure is formed when the price of an asset rejects a liquidity level, then forms a resistance level or a support level before finally breaking and closing above the newly formed resistance level or below the newly formed support level.
b. Confirmation of Trade
Don't rush into the trade, rather wait for the price of the asset to reject the liquidity level, and then form either a resistance or a support level. After that, wait for the price movement to break the resistance of the support level.
When the break has occurred, wait for the broken level to be retested again (therefore forming a new resistance and support level). Finally, allow the price of the asset to close above the newly formed support level (in the case of an uptrend), or close below the newly formed support level (in the case of a downtrend).
c. Execute Trade
After the trade has closed above or below the newly formed resistance or support level as the case may be, execute the trade order.
Below are screenshots showing a Buy situation using BRB.
To exit a trade using the BRB strategy, you need to set the points where you want to take profit or stoploss (N/B, it is best to set them a little bit above the swing high and the swing low.
Setting the stoploss will cause the trade to stop automatically if the market begins to move against you. The take profit helps you to secure your gain when the market gets to a point in the direction you predicted. This is to prevent you from losing all you gained when the market starts to reverse.
It's best to set the ratio of take-profits and stop loss to a minimum of 1:1. This way you don't risk more than you hope to gain.
Question 4: DRAW LIQUIDITY LEVELS TRADE SETUPS ON 4 CRYPTO ASSETS
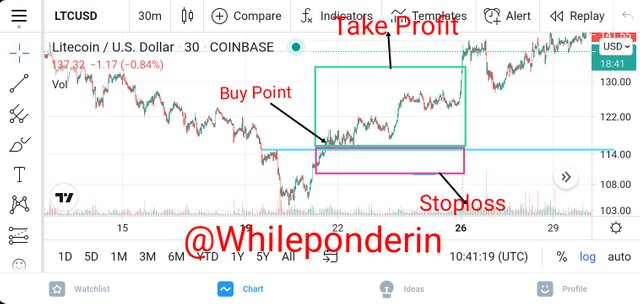
Asset 1: LTC/USD (Buy)
The chart below shows how to trade LTC/USD around liquidity level using the BRB strategy
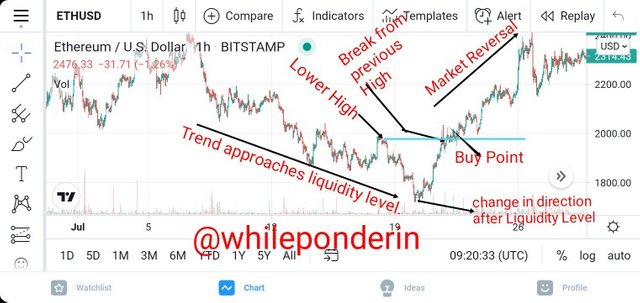
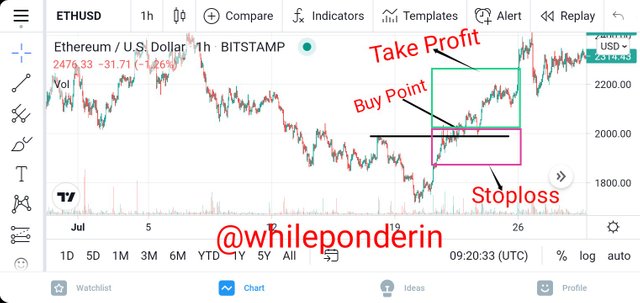
Asset 2: ETH/USD (Buy)
The chart below shows how to trade ETH/USD around liquidity level using the MSB strategy
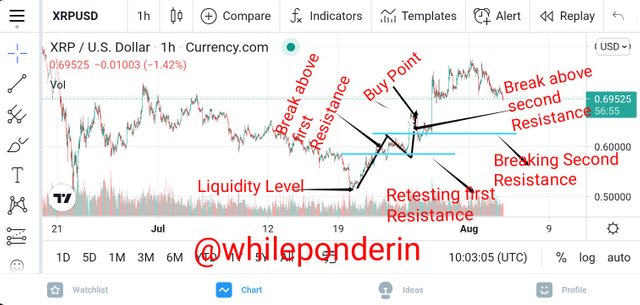
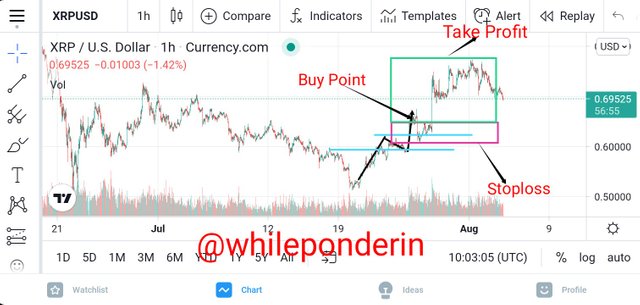
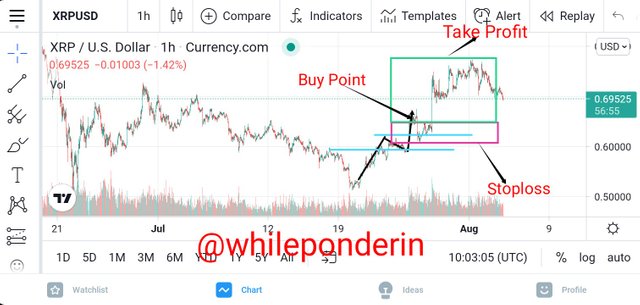
Asset 3: XRP/USD (Buy)
The chart below shows how to trade XRP/USD around liquidity level using the MSB strategy
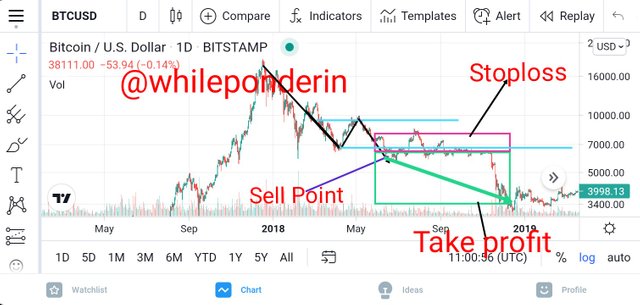
Asset 4: BTC/USD Sell Setup
The chart below shows how to trade BTC/USD around liquidity level using the BRB strategy
Every business man wishes to make the most profit out of all his investment. This fact also applies to institutional investors (like brokers and exchanges). In other to make more profit these large investors normally manipulate the market to their favor, and to the disfavor of the small scale trader.
For this reason, trader must learn how to use strategies like MSB and BRB so as to be able to know when the market is being influenced by the institutional investors, how to make profit alongside them, and not fall for their traps.
Thank you professor @cryptokraze for this lesson.

