Crypto Academy / Season 3 / Week 6 - Homework Post for [@asaj]: Vortex Indicator Strategy.
Hello everyone, welcome to week 6 of Crypto academy's season 3. In today's lecture, professor @Wong while teaching on the topic "Vortex Indicator Strategy" explained to us all we need to know about the Vortex Indicator and how to trade with it. Below is my response to the assignment he gave after the class.

Question 1: IN YOUR OWN WORDS EXPLAIN THE VORTEX INDICATOR AND HOW IT IS CALCULATED
Vortex Indicator is one of the trend indicators used by traders to know when to enter a trade and when the market trend is about to change. This technical tool was introduced by Douglas Slepman and Etienne Botes in 2010. These two analysts developed the vortex indicator from the idea they got from the True Range concept, which was created by J. Welles Wilder (popularly known as the father of RSI).
In the initial times, the vortex indicator was only used to trade and analyze the stock market. Recently, it has been applied in trading and analyzing the cryptocurrency market.
Vortex indicator is made up two important lines. The positive trend line is referred to as the +VI line while the negative trend line is referred to as the -VI line.
Whenever a trader sees the +VI line above, it means that the number of buyers in the market is much more than the number of sellers in the market, therefore the market is moving in the uptrend direction. On the other hand, whenever a trader notices that the -VI line is above, it means that the number of sellers in the market is much more than the number of buyers in the market, therefore the market is moving in the downtrend direction.
During trading when traders notice that these two lines (+VI and the -VI) has crossed each other, they take it as a trade signal. These trade signal can be a buy or sell signal depending on which of the lines crosses above the other. If it is the +VI line that crosses above the -VI line, it is a buy signal, and it suggests to the trader to buy an asset. If on the other hand, it is the -VI line crosses above the +VI line it is a sell signal.
The two lines that make up the vortex line (+VI line and -VI line) are plotted accordingly to the difference in the period highs and lows created by the movement of the assets price. For instance, the +VI line is plotted in direct proportion to the difference between the market's current period high and the period low obtained from the previous market. If this large discrepancy is in the positive, the positive value will cause the +VI line to move in the upward direction.
On the other hand, -VI line is plotted in direct proportion to the difference between the market's current period low and the period high obtained from the previous market. If this large discrepancy is in the negative, the negative value will cause the -VI line to move in the downward direction.
The space between the +VI line and the -VI line is an indication of the strength of the market trend. If the space between the two trends is very large, it is an indication that the strength of the market trend is high.
Two things are important when calculating the vortex indicator. The first is that the market must be in a trend situation (either up or down), and the other is the period used. Based on these two things the concept of True Range developed by Wilder is applied during the calculation.
Concept of True Range involves finding the difference between the markets current high (or lows) and then comparing it with the previous close of the market. It is the difference between this two that indicates the direction the vortex line moves.
The period itself represents the sample size that is to be considered during the vortex line calculation. This sample size is a time frame, and it can be in days, minutes or hours depending on the timeframe of the chart. For instance, when a vortex indicator is plotted with a period of 30 is applied to a a daily timeframe chart, the vortex indicator calculates the True Range of the market using a 30 days sample size. Likewise, of the a period of 30 is applied to 1 hourly timeframe chart, the vortex indicator calculates the True Range of the market using a 30 hours sample size.
The period used in calculating the vortex indicator is not constant. A trader can choose a period he wishes to use as a basis of his study by changing the default period setting of the indicator.
It's worth noting that the Vortex Indicator works best in markets that are trending, nonetheless, it is advisable that the trader Combines the vortex indicator with other technical indicators so as to confirm if the signals given by the vortex indicator is true or false.
Question 2: IS THE VORTEX INDICATOR RELIABLE? EXPLAIN
In my own opinion, I believe that no technical indicator should be the sole basis upon which a trader decides to go into a trade. This is because, there is no indicator that puts into consideration all the factors that affects the market before making deductions. Every technical indicator just selects a portion of the information obtained from the market and then uses it as a basis for predicting the market.
Another reason is that the market is really not predictable. For instance, every thing might be going well, and all these indicators may be indicating that the market will be going in our favor, then an unpredictable event like a new government policy or change in leadership of a related organization may cause the market to reverse.
It is true that the vortex indicator is one of the best indicators we have, but due to the reasons stated above, I think it's not advisable to use it as the only source of trade signal. Rather, every information obtained from it should be compared with other indicators so as to filter off the few false signals it may give. This increases the trader's chance of winning in a trade.
Some of the technical indicators that can be used in addition to the Vortex indicators to confirm if a certain trade signal is correct includes MACD, moving average, RSI Divergence, etc.
Question 3: HOW IS THE VORTEX INDICATOR ADDED TO A CHART AND WHAT ARE THE RECOMMENDED PARAMETERS
To show this, I will be using my tradingview app.
Step 1:
Launch the Tradingview app, and then open the chart of an asset you wish to consider.
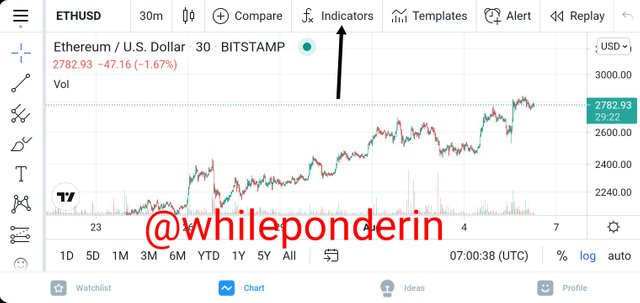
Step 2:
When the chart had been displayed, click on "Fx indicator", as shown below.
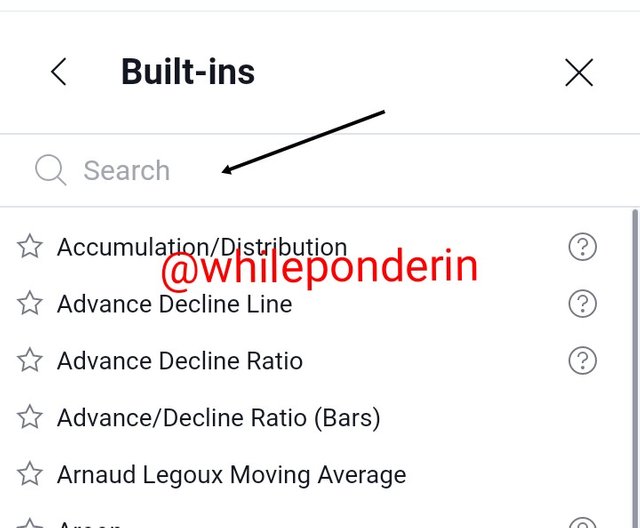
Step 3:
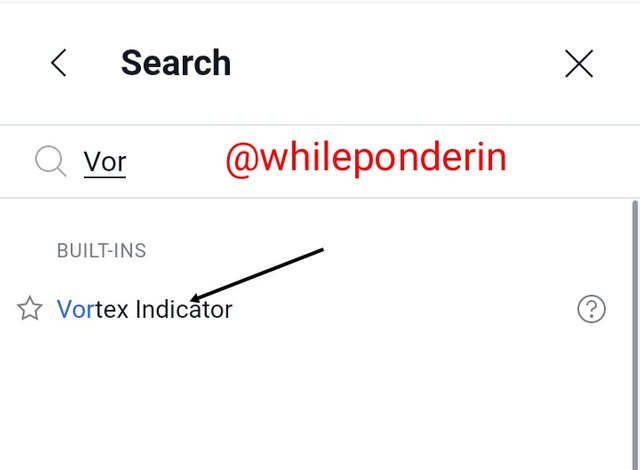
When you do, a page containing the list of indicators in the Tradingview App. On the search bar type in "Vortex Indicator" and then click on it to add it to your chart.
Step 4:
Go back to the chart. You will notice that the Vortex Indicator has been added to the chart.
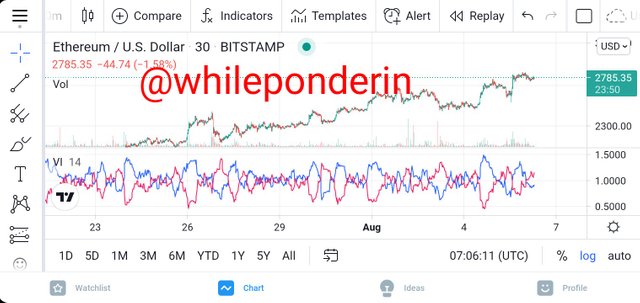
The default setting of the vortex indicator sets the color of the +VI and -VI lines as blue and red respectively. Also the period is set as 14.
Step 5:
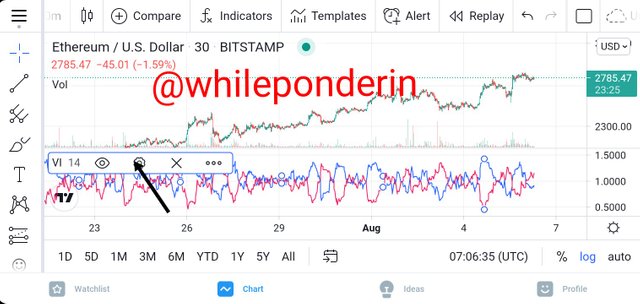
If you wish to modify the indicator to your own specification, gently tap on the chart and then click on the small setting Icon that pops up.
Step 6: Settings
When you click on setting, the setting menu of the indicators comes up. All the parameters of the indicator are classified and placed in three tabs: inputs, style, and visibility.
Input Tab
On the input tab you can change the timeframe the indicator follows, and also the period of calculation. This period is referred to as "length" in tradingview. On the default setting, the length of the indicator is kept as 14. This means that the True Range of the market will be calculated based a 14 sized sample.
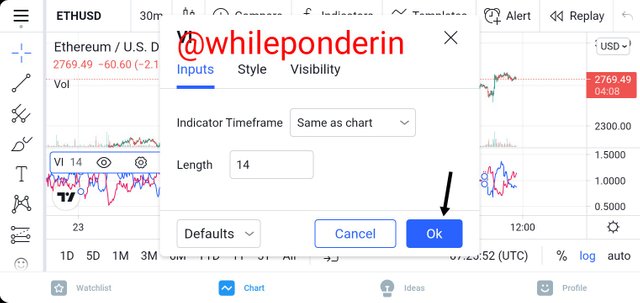
You can change the period or length of the indicator to any size of your choice depending on the result you wish to obtain.
After making your changes, click on "Ok" to apply.
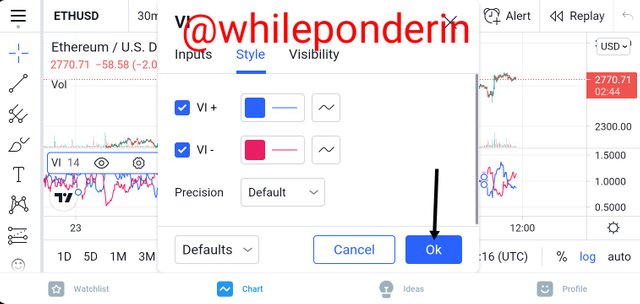
Style
It is on this section that the color of the +VI and the -VI can be changed. Based on default setting, the +VI line is set to have a blue color, while the -VI line is set to have a red color. You can change the color if you wish. When you are done, click on "Ok" to apply your changes.
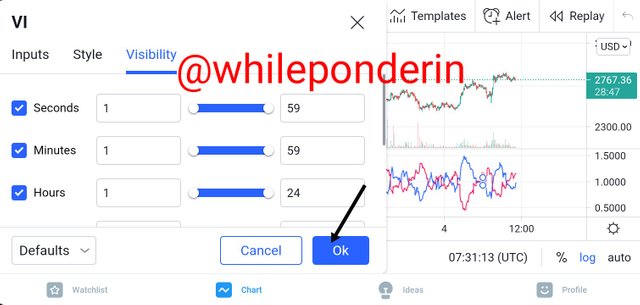
Visibility
This tab is where the trader can setting the time frames where the indicator can appear on.
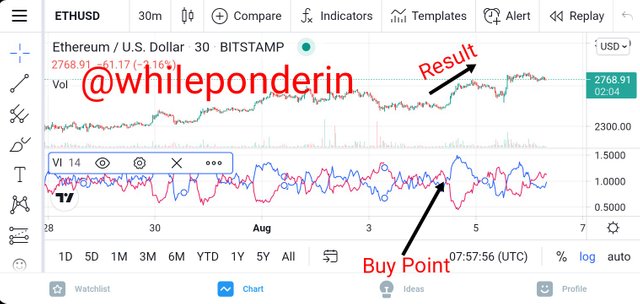
Question 4: EXPLAIN IN YOUR OWN WORDS THE CONCEPT OF VORTEX INDICATOR DIVERGENCE WITH EXAMPLES.
Whenever the term "divergence" is used in trading, it means that there is a difference between the direction the price of an asset is going and what the indicator used is showing. Based on this, I define vortex divergence as a situation that occurs when the vortex indicator is indicating a trend contrary to the direction of the market.
We have two types of vortex indicator divergence. They are:
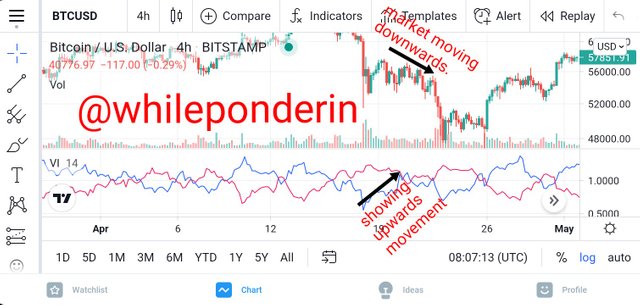
a. Bullish Vortex Divergence
A bullish vortex divergence is said to have occured when the indicator is showing an upward movement, but the market price chart is showing a downward in the price of the asset at that same time.
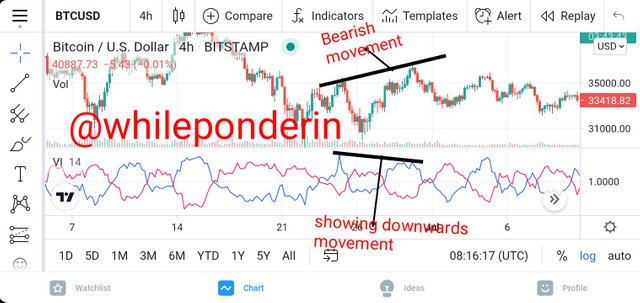
b. Bearish Vortex Divergence
A bearish vortex divergence is said to have occured when the indicator is showing a downward movement, but the market price chart is showing an upward movement in the price of the asset at that same time.
Once a trader notices the occurrence of a vortex divergence on the chart, it is an indication that the market will soon reverse in the direction predicted by the vortex Indicator. Nonetheless, it's advisable to compare this prediction with other indicators so as to confirm the market reversal.
Question 5: USE THE SIGNALS OF VI TO BUY AND SELL ANY TWO CRYPTOCURRENCIES.
I will be using my meta5 Demo account to buy and sell cryptocurrencies based on signals obtained from the VI indicator.
Asset 1: BTC/USD: 30 Minute Chart (BUY)
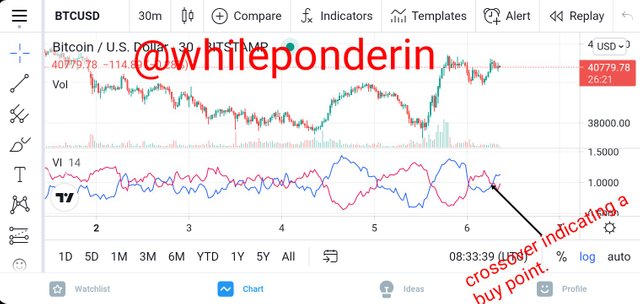
Looking at the chart above, you will notice that the +VI line of the vortex indicator has crossed above the -VI. This cross line movement is an indication that the market will move in an uptrend direction, So I initiated a Buy Trade.
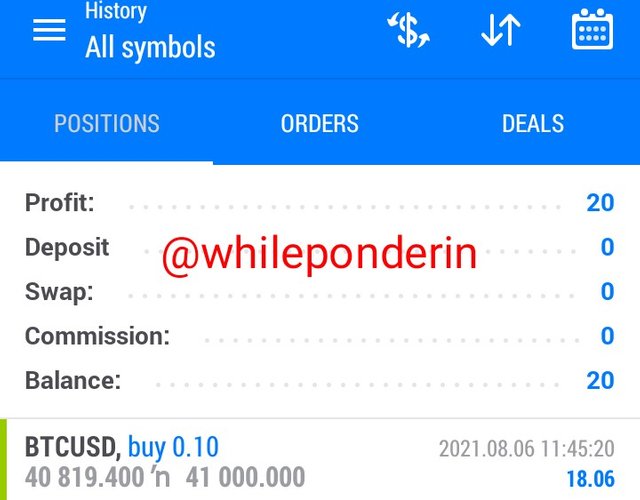
Profit Made
I performed the trade ony Meta4 demo account and I made a profit of $18.06. This is shown in the screenshot below.
Asset 2: ETH/USD Hourly chart (Sell)
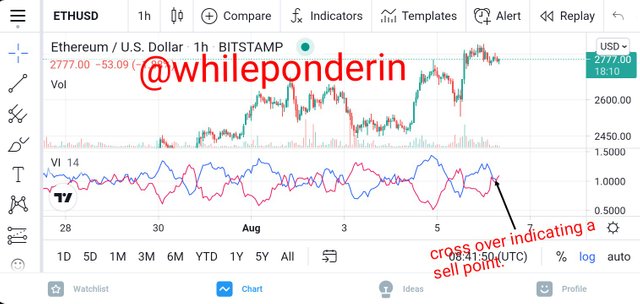
Looking at the chart above, you will notice that the -VI line of the vortex indicator has crossed above the +VI. This cross line movement is an indication that the market will move in a downtrend direction, So I initiated a Sell Trade.
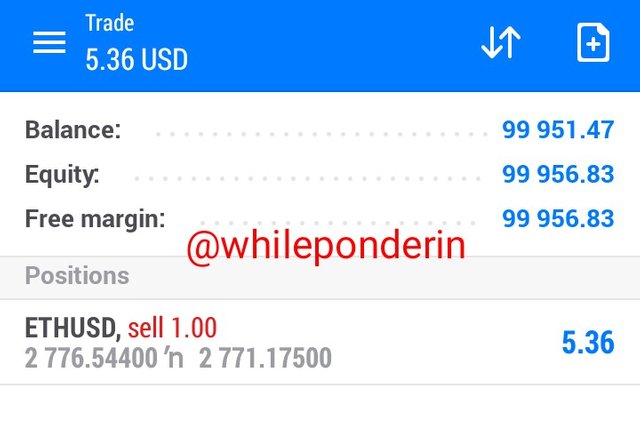
Ongoing Trade
I performed the trade ony Meta4 demo account. The trade is ongoing Currently, but already I have made profit of $5.36. This is shown in the screenshot below.
Note:- I performed the trades above based on signals given by the vortex indicator alone, so as to know how reliable it is
Vortex indicator is one of the best technical indicators we have. This indicator gives the trader signals of a possible buy and sell trade. It also shows the trader signs of a market reversal.
Although the vortex has a relatively high level of accuracy, it's advisable to confirm the signals it gives using other indicators like MACD, RSI and Moving Averages, so as to be sure the trade it suggests that you enter will be a profitable one.
This article was sponsored by My Recipe Checklist
Thank you professor @asaj for this amazing lesson.
Good job @whileponderin!
Thanks for performing the above task in the sixth week of Steemit Crypto Academy Season 3. The time and effort put into this work is appreciated. Hence, you have scored 8 out of 10. Here are the details:
Remarks
You have demonstrated a good understanding of the topic.
Thank you Professor @asaj.