Crypto Academy / Season 3 / Week 5- Homework Post for Professor @imagen - Topic: Market Patterns and Blockchain Projects.
Before investing on any crypto asset, it's very important that the trader carries out both fundamental and technical analysis on the asset. Technical analysis involves the interpretation of several indicators indicators on a trade chart such as Candlestick patterns, while fundamental analysis involves analyzing the main details of the project e.g it's roadmap.

In today's lecture, professor @imagen while teaching on the topic "Market Patterns and Blockchain Projects" explained to us how to conduct but technical and fundamental analysis on a crypto asset before investing on the asset. Below is my response to the assignment he gave after the class.
Question 1: CHOOSE AT LEAST 1 OF THE FOLLOWING CRYPTOCURRENCIES: Axie Infinity AXS, Chilliz CHZ, Cardano ADA, VeChain VET. MAKE AN INVESTMENT. SHOW SCREENSHOTS OF THE PROCESS. WHY DID YOU CHOOSE THIS CRYPTOCURRENCY? WHAT IS IT MARKET CAPITALIZATION? WHAT IS IT POSITION IN THE CRYPTOASSET RANKINGS? WHAT IS THE OBJECTIVE OF THE PROJECT BEHIND THIS COIN? WHO FOUNDED THIS COIN? SHOW THE ROADMAP. WHAT IS THE SPECIFIC PURPOSE OF THE CRYPTOCURRENCY?
I chose Cardano.
Among the several cryptocurrencies in the world, the one that have impressed me the most is Cardano (ADA). This cryptocurrency runs on a decentralized blockchain called Cardano, which allows the miners to validate blocks based on how many coins they hold (proof of Stake).
The project "Cardano" was founded by Charles Hoskinson (who is also Ethereum co-founder) in 2015. Cardano was designed to be an alternative for Ethereum. It is more like an updated version of Ethereum. The cryptocurrency itself wasn't launched until 2017. Since the time it was launched till today, Cardano has been making remarkable progress.
In other to know if a cryptocurrency is going to be prosperous we have to check if it has a road map and how consistent it has been in keeping with the road map. In the case of Cardano, it has a roadmap which are classified under "five eras". These eras are: Byron (foundation), Shelley (decentralization), Goguen (smart contracts), Basho (scaling), and Voltaire (Governance). Each of these eras represents an achievement level in Cardano's roadmap, and it is considered to be complete when a certain number of features are added into the Cardano Blockchain.
Based on the progress that Cardano has made since it was introduced, we can clearly see that its growth has been on a steady pace and it has been consistent with it's roadmap. Right now, Cardano is regarded as one of the best platforms for launching smart contracts and several DApps.
Specific Objective
Specifically, Cardano was designed to solve certain problems such as scaling and infrastructure problems was observed in Bitcoin and Ethereum. Scaling problem refers to the high transaction fees and the slow in network which occurs if large volumes are transacted in Bitcoin. Cardano has been able to solve both problems using their algorithm called Ouroboros.
Market Capitalization and Crypto ranking.
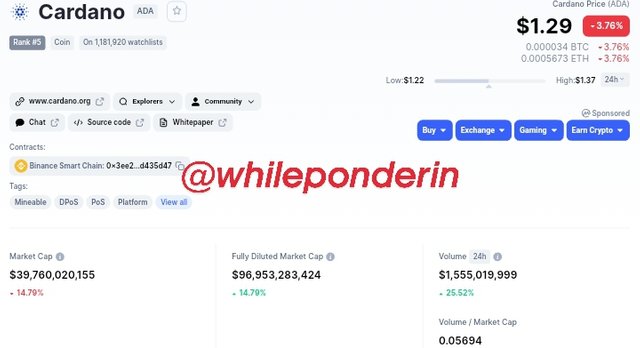
As of the time of this post it's worth $1.29, and it has a market capitalization of $39,760,020,155, and a trading volume of $1,555,019,999 in the last 24 hours. Currently, Cardano is ranked number #5 according to coinmarketcap.
1.The team of developers:
The success of a project is determined by how experienced the development team is. The more experienced they are, the higher the probability of the project becoming successful. Cardano has a group of experienced developers working on it. The head of the team is Charles Hoskinson who is one of the founders of Ethereum. This is a clear indication that Cardano is definitely going to achieve the height that Ethereum has achieved, and probably supercede it.
2.Security:
The whole ecosystem of Cardano runs on blockchain Network. This implies that every thing is secured, decentralized and transparent.
3.Price of the currency:
Although Cardano is worth only $1.29 today, many experts believe that it has the potential of getting to the level Bitcoin is in today. This means that Cardano will one day worth thousands of dollars, and it's advisable that every trader invest in the currency now.
4.Achieving all goals in the Road map:
It's very clear to everyone that Cardano has been consistent in achieving all the goals in it's road map. This implies that it has comes to stay, and we are yet to see it's greatest achievement.
I will be making a purchase of ADA using BUSD in my Binance account.
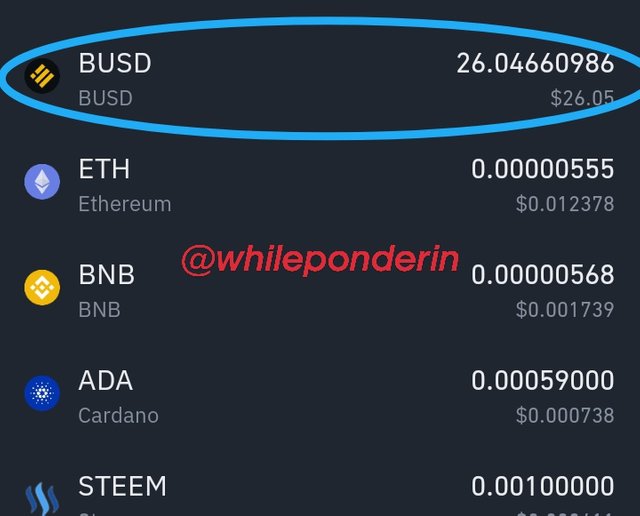
Step 1:
First thing I did was to check my portfolio to see if I had enough BUSD for the transaction. When I did, I saw that I had BUSD worth about $26.
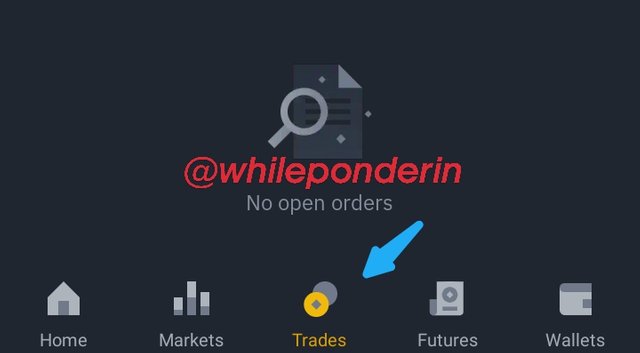
Step 2:
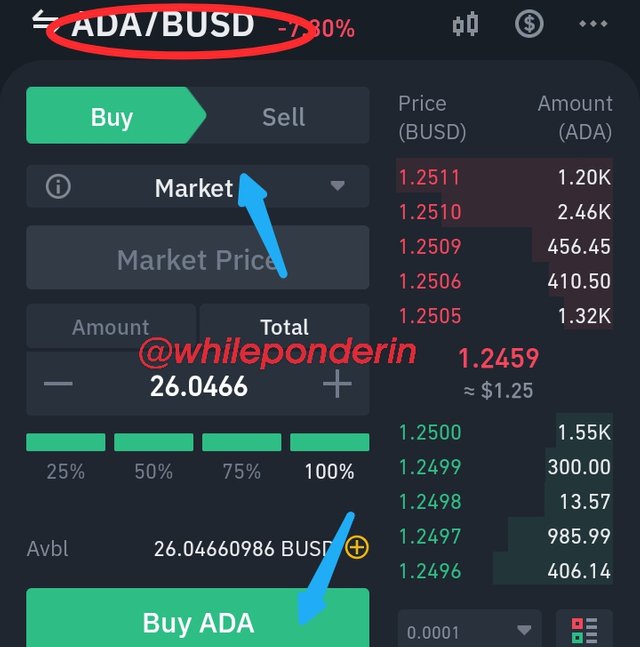
I click on Trade, as shown below. When the page came up, I click on "spot". After that, I selected the trading pair ADA/BUSD by clicking on the pair that is in the page already. This is shown in the screenshot below.
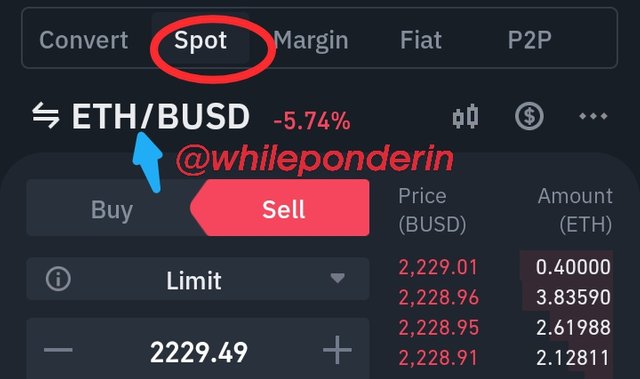
Step 3:
After selecting the trading pair, I changed "limit" to "market price" by clicking on it. After that I selected the volume of BUSD I wish to spend in buying ADA. After that, I clicked on "Buy ADA".
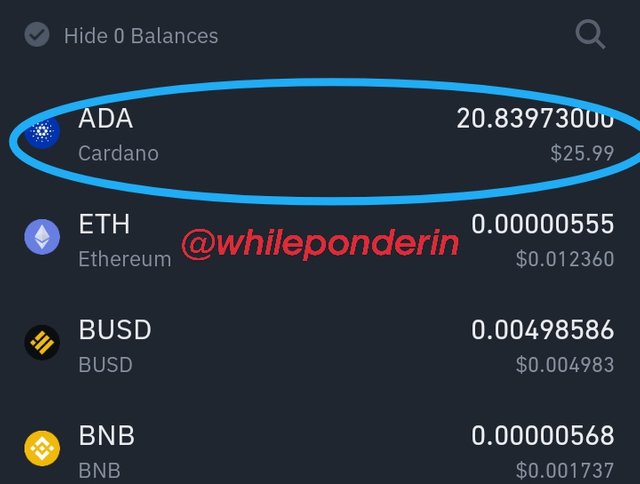
Proof that I Invested in ADA
This is my portfolio after the investment, showing that I have ADA worth $25.99.
Question 2: EXPLAIN IN YOUR OWN WORDS WHAT THE "EVENING STAR" PATTERN CONSISTS OF. WHAT IS ITS HIT RATE?
An evening Star is a candlestick pattern that forms in a trade chart. Whenever it forms, it is an indication that the trend of the market is about to reverse to the negative. An evening star is made of three candlestick: a large bullish candlestick, a candlestick (either bullish or bearish) with a small-body, and a bearish candlestick.
According to Bulkowski, evening star candlestick pattern can predict lower prices to an accuracy of about 72%.
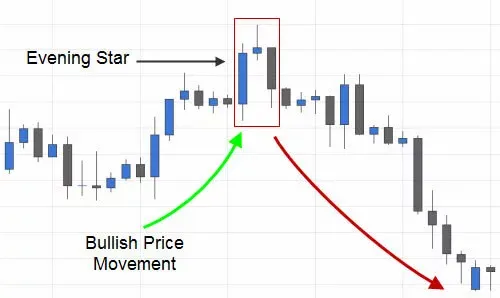
If a chart has the following, we can say that an evening star has been formed. Therefore a market reversal has occurred.
a.Direction of the market:
The direction of the market in the previous days must be in the uptrend direction. This is because evening star indicates a market reversal from uptrend to downtrend.
b.Formation of a large bullish Candle due to the activities of the buyers:
Here the buyers buy more of the asset, pushing the market further up, and thus creating a large bullish candlestick. At this point there is no indication of market reversal.
c.Formation of a small bearish/bullish candle:
The Small bearish or bullish candle is formed as a result of the trading activities of both the buyers and sellers being almost in equilibrium. This is why this candle is called the indecision candlestick.
d.Formation of the Large Bearish Candle:
The formation of this candle stick reveals that the action of the sellers has superceded the action of the buyers. Once this happen, it is an indication that a downward trend has begun.
Question 3: EXPLAIN IN YOUR OWN WORDS WHAT THE PATTERN "ABANDONED BABY" CONSISTS OF. WHAT IS THE PERCENTAGE CORRECT?
The abandoned baby is a candlestick pattern which when formed indicates a reversal in the market trend. The pattern consist of two candle bodies, a gap and then one doji. According to Bulkowski, this pattern has an accuracy rate of 49.73%.
The major difference between Abandoned Baby and Morning and Evening Star is that the candle sticks doesn't overlap in abandoned baby pattern, unlike in morning and evening star pattern.
We have two types of Abandoned Baby, they are: Bullish Abandoned Baby and Bearish Abandoned Baby. Both are explained below
Whenever a bullish abandoned baby candlestick pattern is formed on a trade chart, it indicates that a reversal of a downtrend market into an uptrend market.
The bullish abandoned candle consist of the following
- large bearish (or red) candle,
- A doji candle with a gap that closes below the first large bearish candle.
- Lastly, a large bullish candlestick that opens above the doji.

Once this pattern is formed, the next thing to expect is the downtrend market reversing into an uptrend market
Whenever a bearish abandoned baby candlestick pattern is formed on a trade chart, it indicates that a reversal of an uptrend market into a downtrend market.
The bearish abandoned candle consist of the following
large bullish (or green) candlestick,
A doji candle with a gap that closes above the first large bullish candlestick.
Lastly, a large bearish candlestick that opens below the doji.

Once this pattern is formed, the next thing to expect is the uptrend market reversing into a downtrend market
Note 1: The doji on both patterns represents a moment of uncertainty. At this point the action of the buyers equals the action of the sellers.
Note 2: Before concluding that the pattern is an abandoned baby, you must make sure that there are gaps between the first candlestick and the second candlestick (doji). Also there should be a gap between the second candlestick (doji) and the third candlestick. They must not over lap
Question 4: PERFORM ANALYSIS FOR 3 AND 7 RECENT CALENDAR DAYS FOR BITCOIN. DO YOU IDENTIFY ANY PATTERNS? SHOW SCREENSHOTS
Below is a 4-hour BTC chart.
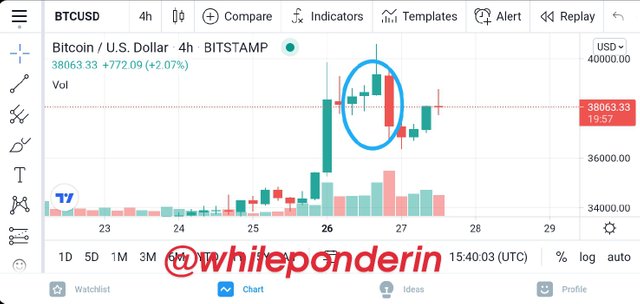
Looking at the chart above, we can see that there was a formation of Bullish three line strike yesterday. As you can see, from the area circle with a blue marker, there first three candlestick were bullish, while the last candlestick was a large bearish one. This last bearish candlestick seem to erase all the advances that the three bullish candlesticks made.
What it Signifies..
The first three bullish candles shows that buyers are buying BTC massively causing the market to enter the overbought region. Some traders who believe that even if the price asset falls, it will quickly recover, begins to sell their asset massively. This sudden massive sell causes the value of BTC to fall quickly in a short time, as shown by the bearish (red) candlestick.
Nonetheless, this change is temporal, as more buyers continues to buy BTC pushing the asset once more in the uptrend direction.
Normally, a bullish three line strike indicates that the current trend (uptrend) will continue to go on, as we can see in this case, but some times, it may not be so. Therefore, it's best to watch the market for some days before making a final decision.
Below is a 4-hour BTC chart.
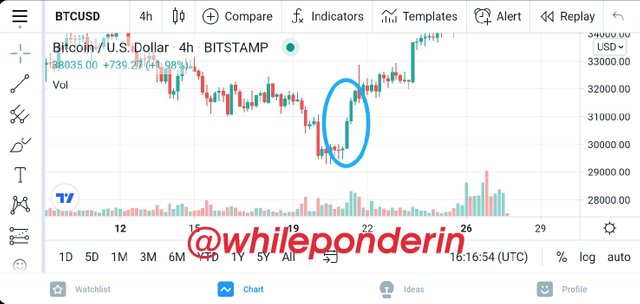
Looking at the chart above, we can see that the candlestick pattern has formed Three white Soldiers on the 21st of this month. As you can see, from the area circle with a blue marker, the pattern consist of three consecutive bullish candlesticks. Each of the candlestick open within the real body of the previous and then closes above the previous candle.
What it Signifies.
Once a trader notices three white soldiers candlestick pattern in the trade chart, it is clearly an indication that there is a change in the market psychology, therefore the downtrend market has now reversed and has began to move in the uptrend direction. This market reversal can be seen in the trade chart above.
A trader should carry out both technical and fundamental analysis before he invest on a crypto asset. Fundamental analysis involves going through the project's whitepaper and roadmap so as to be sure that the project has a future.
Technical analysis involves using indicators and studying patterns found in the chart. Using these patterns, such as abandoned baby, bullish three line strike, and three white soldiers, a trader can predict the next move of the market.
Thank you so much professor @imagen.
Also Read: Transmission Rebuild – (Everything to Know)
Gracias por participar en la Tercera Temporada de la Steemit Crypto Academy.
Te felicito, realizastes un gran trabajo.
Espero seguir corrigiendo tus proximas asignaciones.
Thank you professor @imagen.