Crypto Academy / Season 3 / Week 2- Homework Post for Professor @reminiscence01 - Topic: Introduction to Charts.
Predictions about the future is always based on facts obtained from the events of yesterday and today. No trader can be able to correctly predict tommorow's market if he doesn't know the current price of the asset today, and it's past prices.
Considering the fact a particular asset which the trader wants to buy or sell has been transacted for a long period of time, you will agree with me that if these prices are not organized in a more concised manner, the trader will find it so hard to access the information that will enable him make the correct decisions even though the information is staring him on the face.
Thanks to the introduction of charts, these bulk informations can be represent in a more orderly and concised form by using lines, symbols, images, graphs and lots more, such that the trader can have a general overview of the market within a certain period at just one glance, and with the information he obtained from the chart, he can carefully analyze the market. In the cryptomarkets, we have several charts that gives full interpretation of what the market is like, but if you don't understand what these symbols represent, you won't be able to make use of them.

In today's lecture, professor @reminiscence01 while teaching on the topic "Introduction to Charts" has explained to us what crypto charts are, and how to interpret the symbols used in the chart. Below is my response to the assignment he gave after the class.
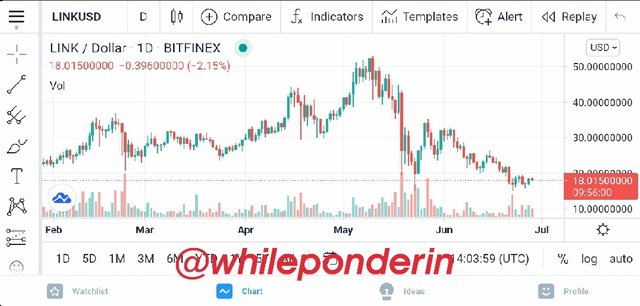
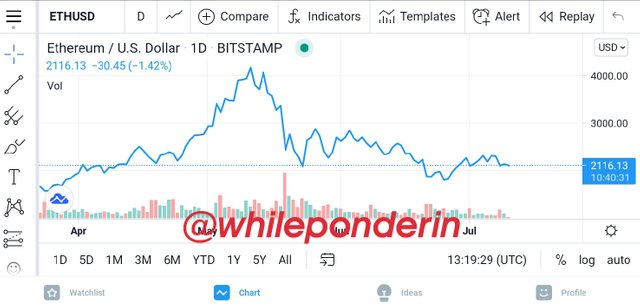
Question 1: EXPLAIN THE JAPANESE CANDLESTICK CHART? (CHART SCREENSHOT REQUIRED)
The Japanese Candlestick chart is the most used of all charts in cryptotrading. This chart was developed by Munehisa Homma, who was a Japanese rice trader that lived in the 1700s. The Japanese Candlestick chart is chart of which trade informations are represented by several "Japanese Candlestick". It us basically used to carry out the technical analysis of a trade. With this chart, a trader can tell what the market price is, what's direction the market is going today and what the market was like in the past.
One of the notable characteristics of the Japanese Candlestick chart is that it is time bound. This implies that the trader can monitor the changes in the market based on a time frame of his chosing. These time frame can be 1 minute, 10, minutes, 25 minutes, 1 hour, 1 day, 1 month and lots more.
For instance, assuming that the crypto trader decides to set his market at a 25 minutes time frame, the chart will reconfigure itself such that it will take 25 minutes for the candlestick to form. When the candle finally forms after 25 minutes, it will capture every price level of the trade, such as the opening price, the closing price, the highest and the lowest price that occured within the specified 25 minutes.
A Japanese candlestick consist majorly of four parts, and these parts represent the four major prices of an asset within a specified time frame. These prices are explained below.
Open: The open of a Candlestick represents the price of the asset when the candlestick was open. As stated earlier, the candlestick chart is based on a time bound, if for instance the time-bound selected by the trader is 25 mins, then the open price or the starting price of the candlestick is the price of the market at the beginning of the 25 mins.
Close: This close of a Candlestick represents the price of an asset when the candlestick finally closes, or ends. It is the last entry price of the asset before the Candlestick time frame concluded.
High: As its name implies, the high of a Candlestick represents the highest price of an asset within the stipulated time frame of the candlestick.
Low: The low of a candlestick represents the lowest price of an asset within the stipulated time frame of the candlestick.
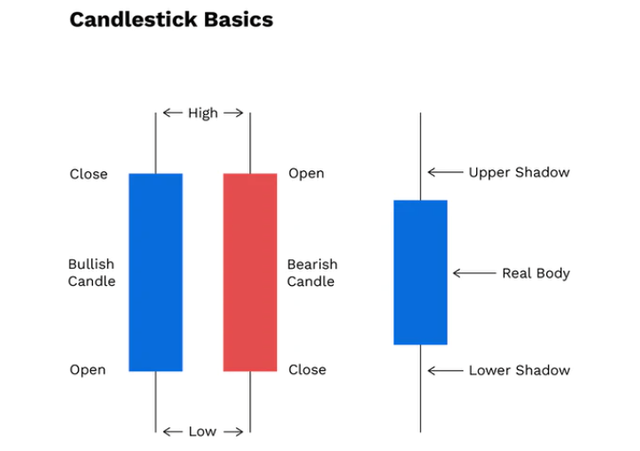
Real Body: The real body of a Japanese candlestick is the real distance the price of an asset moved from the start to the close of candlestick. These price are not fluctuations, rather they are the steady prices of the asset within the time frame.
Shadow Body: This area reveals the struggle between the sellers and the buyers, as the prices in these areas are unsettled prices, that couldn't close within the selected candlestick timeframe.
In addition, based on the position of the "Close" and "Open" on a Japanese Candlestick, we can tell whether the candle is a Bearish or a Bullish candlestick. When the Open price is greater than the close price, we say the Candlestick is Bearish, but when the close price is greater than the open price, we say the Candlestick is bullish.
When there is a continuous formation of the bullish candlestick, we say that the chart is experiencing a Bullish Trend, but when there is a continuous formation of the Bearish Candlestick, we say that the market is experiencing a Bearish Trend
Question 2: DESCRIBE ANY OTHER TWO TYPES OF CHARTS? (SCREENSHOT REQUIRED)
Apart from the Japanese candlestick, we have several other types of charts. To answer this question, I will be describing the line chart and the bar chart.
The line chart represented the price history of the asset with the aid of a single continuous line. Each of the pointed points on the line chart represents the closing price of the asset for a given period of time. Thus, the line in a line chart connects the closing price of an asset for a given time frame to the closing price of the next time frame.
Since the line chart doesn't concern itself with other prices like the opening, high and low prices, it actually offers a quick analysis of the market in the long term timeframe.
Although the use of only the closing price makes the chart more concised, it's lack the enough information needed to predict the price of the market accurately. Due to it's insufficiency majority of traders don't use it in analyzing the market.
Some characteristics of the Line Chart
It only records the closing price of a specified time frame.
It's time values are plotted in the horizontal axis, while it's price values are plotted on the vertical axis.
It doesn't reveal informations of the asset such as high price, low price and open price, for that specified time frame.
Advantages of Line Chart
It's gives a quick analysis, or general overview of the market.
It is not complex, thus beginners can easily interpret it.
It's very easy to identify points in the graph such as the resistance and the support lines.
Disadvantages of Line Chart
It doesn't reveal to the trader what the low price, high price and open price of the asset is at a specified timeframe.
Due to it's insufficiency in information, it's not suitable for making accurate market predictions.
The bar chart has some of the properties Japanese candlestick chart, although they don't look alike. For instance, it gives informations such as the open, close, high and low prices of an asset within a time frame, just like the Japanese candlestick chart.
The bar, in a bar chart can be interpreted as follows:
The open price of an asset within a time frame is represented on the left side of the bar, while the close price is indicated on the right side of the bar. The high and low prices of the asset is indicated by the height of the bar.
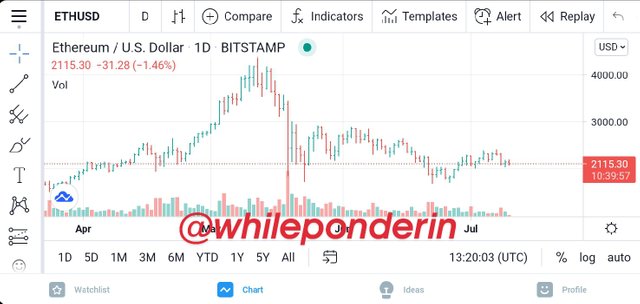
If, for instance, the difference (or volatility) between the price of the high and low prices are large, then the length of the bar will be very long, if on the other hand the difference (or volatility) between the open and close prices is small the bar will be a short one.
Also, if the closing price is greater than the opening price, the market is considered to be a Bullish market, and most times the bar is colored green by traders since the market is in the positive or good direction. If on the other hand, the open price is greater than the close price, the market is said to be a Bearish market and most times the bar is colored red by traders since the market is in the negative direction.
Question 3: IN YOUR OWN WORDS, EXPLAIN WHY THE JAPANESE CANDLESTICK CHART IS MOSTLY USED BY TRADERS.
There are several reasons why traders chose to analyze the market using the Japanese candlestick chart instead of other types of chart. The first is the fact that the Japanese candlestick chart provides all the necessary informations the trader need to completely analyze the market, unlike other charts. These informations includes the opening price, the closing price, the highest price as well as the lowest price of an asset for a given time frame. Using these data, the trader can be able to predict whether the asset is going to go up in price or not, therefore enabling him to decide whether to hold, buy or sell his asset.

Another reason why I think traders prefer using the Japanese candlestick is that, if can be used for both short-term and long term predictions, as its more reliable and encompassing unlike other chart such as the line chart that is only good for long term predictions.
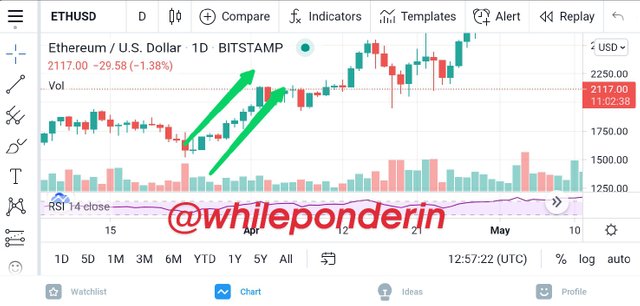
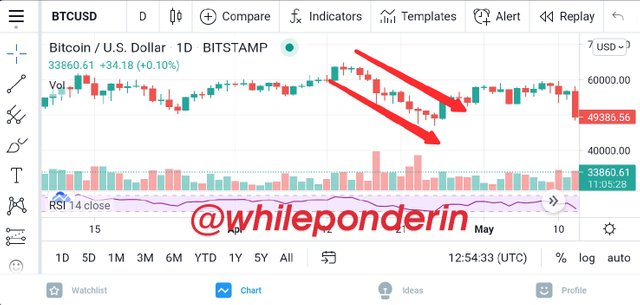
Question 4: DESCRIBE A BULLISH CANDLE AND A BEARISH CANDLE IDENTIFYING ITS ANATOMY? (SCREENSHOT IS REQUIRED)
As stated earlier, the major antomy of a Japanese candlestick represent the open, close, high and low price of an asset for a specificied time frame. Based on the position of the "Close" and "Open" Japanese Candlestick, we can tell whether it is a Bearish or a Bullish candlestick as explained below.
Bearish Candlestick: When the Japanese candlestick is in such a way that it's closing price is less than the opening price, we say that the candlestick is a Bearish candlestick. Normally, traders assign the Bearish candlestick a red color, since it's going in the negative direction (but there is no rule that says it must be red in color, you can make your blue or green). When you have a continuous formation of Bearish candlestick in a chart, we say that the market is experiencing a "Bearish Trend. The anatomy of a Bearish Candlestick is shown below.
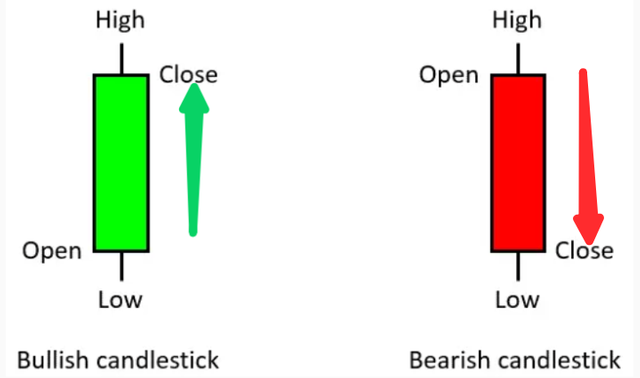
Bullish Candlestick: When the Japanese candlestick is in such a way that it's opening price is less than it's closing price, we say that the candlestick is a Bullish candlestick. Normally, traders assign the Bearish candlestick a green color, since it's going in the positive direction, and as green means life (but there is no rule that says it must be green in color, you can make your blue, red or any other color). When you have a continuous formation of Bullish candlestick in a chart, we say that the market is experiencing a "Bullish Trend. The anatomy of a Bullish Candlestick is shown above.
CONCLUSION
One of the most reliable analysis a trader can carry out before embarking on any trade is the technical analysis, and the only way to carry out a technical analysis on a trade is through the use of trade charts. This, makes charts, especially the Japanese candlestick chart an irreplaceable tool for every trader. Since no trader can make good trading decisions without it, it's very important that every one who wishes to trade cryptocurrencies learn how to make use of it.
Thank you so much Professor @reminiscence01, I learnt a lot from your class.
Also Read: Traction Control Light Won’t Turn Off? – (Causes & Solutions)
Hello Professor @reminiscence01, please professor, am yet to be curated by @steemcurator02 after being reviewed by you. In the review, you rated me 10. Please professor, it's over 5 days already and am worried.
Ok. Thank you for notifying me.
Hello @whileponderin , I’m glad you participated in the 2nd week of the Beginner’s class at the Steemit Crypto Academy. Your grades in this task are as follows:
Recommendation / Feedback:
I expected a technical explanations on Japanese candlestick chart and that is what you provided. You did a great work here. Thank you for participating in this homework task.
Thank you so much Professor @reminiscence01 for the review. Am truly grateful sir.