[Heikin-Ashi Trading Strategy] - Steemit Crypto Academy | S4W2 | Homework Post for @reddileep
Hello Everyone,
Welcome to week 02 with the new crypto prof. @reddileep's lesson. The topic is about a trading strategy and personally I prefer this type of lesson in Crypto Academy. Let’s get started with this homework by using the Heikin-Ashi trading strategy.

Define Heikin-Ashi Technique

- Introduction
There are various chart types to choose in a trading platform such as Line Chart, Candlestick Chart, Renko Chart and Point and Figure charts. From all these charts, one of the lesser-known but very useful type is Heikin-Ashi. It is a variant of Japanese candlesticks chart which can use to visualize the bullish and bearish trends in a single look.
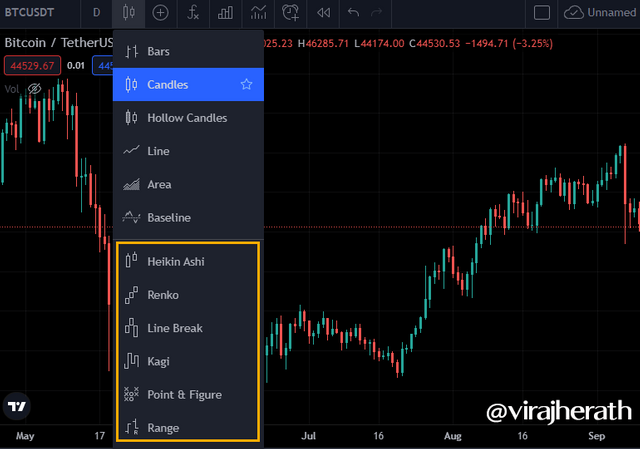
Chart types options on trading view platform
- Heikin-Ashi candle
Heikin-Ashi is a technique created by an experienced Japanese trader Munehisa Homma. He is known as the God of price action trading. The Heikin-Ashi means to say Average Bar due to the fact that it takes midpoint value of the most recent candle as the opening price of the next candle. The process smoothes out the movement in the market and avoids extra noise on a trading chart.
Heikin-Ashi candle has a similar construct to a traditional candle, Both candles use data from open, high, low, and close price action during a particular time frame to formulate the candle. Also, both consist of a body, lower wick/shadow and upper wick/shadow.
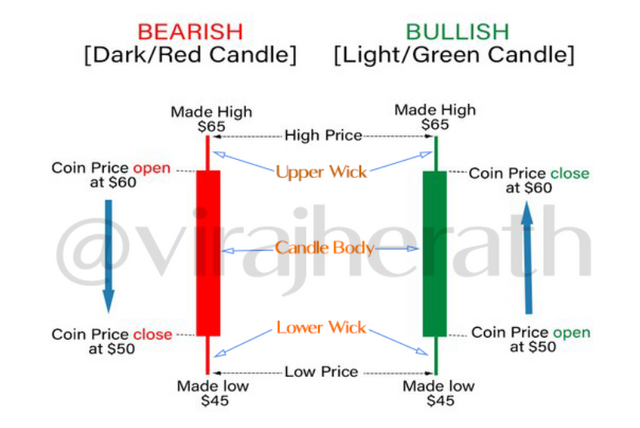
Construction of a candle
- Heikin-Ashi Trading Strategy
When the market is on a strong uptrend, Heikin-Ashi candles have big green candle bodies and long upper wicks but no lower wicks. Conversely, when the market is on a strong downtrend the candles have big red candle bodies and long lower wicks but no upper wicks. When there is a potential reversal Heikin-Ashi candles have a small body with small wicks and they are identified as Indecision candles.
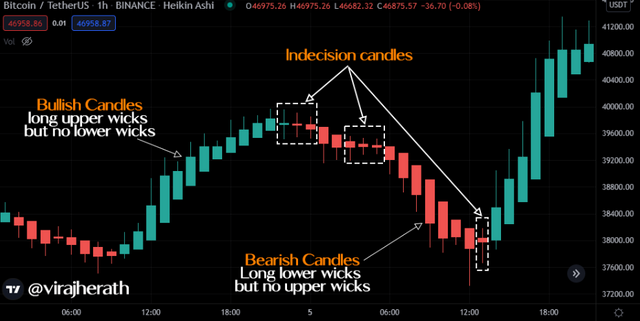
Heikin-Ashi candles illustration on a trading chart
BTC/USDT| 1h | tradingview.com
The entire candle formation can be used as an indicator to identify trend direction, trend strength and the trend reversal. Analyzing these will give an extra edge for a trader to succeed in their trade decisions.
Differentiate between the traditional candlestick chart and the Heikin-Ashi chart
This allows traders to read the chart effectively and assume the trend more efficiently. Let’s look at the below example to get an idea about how this charts looks like.
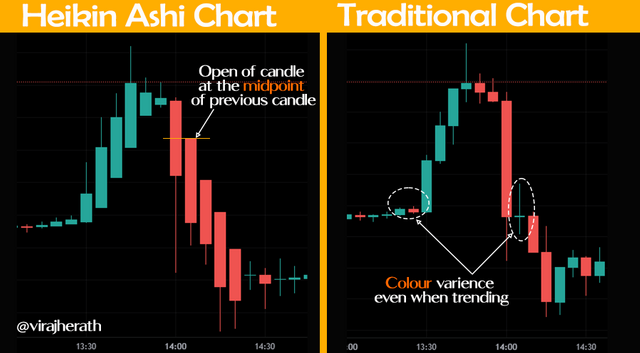
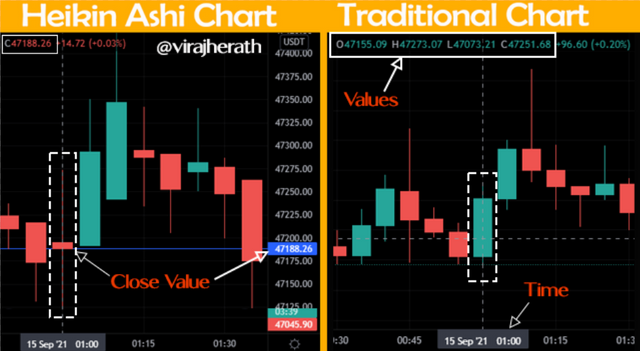
Heikin-Ashi chart vs traditional chart look
BTC/USDT| 05m | tradingview.com
In the above figure, I have taken the same time period on the 13th Sep 13:00 to 14:30 hrs time to demonstrate the difference of look. There you can clearly see Heikin-Ashi candle (left) has always taken the midpoint from its prior candle no matter what the trend is. This is the reason behind less noise on the chart. The clarity of directions makes easier reading of the market trend than the traditional chart. In a traditional chart, traders use the upper and lower wicks to analyze the pattern.
And the other noticeable difference is that the colour variance during a trend. When there is a trend continuation we cannot see colour variance in Heikin-Ashi candle. The colour will only change when there is a potential trend reversal. That is simply because of how it formulated which we are going to discuss on question number 03. However, the traditional chart (right) can see the colour changes while even on a trend according to the price action.
Compares to the traditional chart (right) those are the differences we can see on a Heikin-Ashi chart.
Heikin-Ashi Formula
The calculation for Heikin-Ashi formula is as follow,
- Price Open
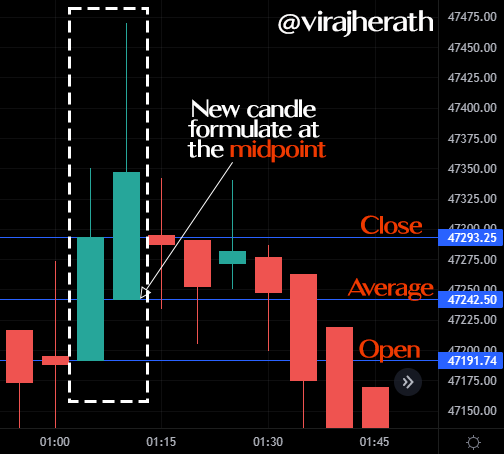
Open = (Open of a previous candle + close of a previous candle)/2
The open of the new candle for Heikin-Ashi take the average price of the previous candle. This implies that every new candle will formulate at the midpoint of the previous candle.
For example, you can see that the below figure.
Heikin-Ashi Price Open illustration
BTC/USDT| 05m | tradingview.com
Open price of previous candle = 47191.74
Close price of previous candle = 47293.25
Opening of new candle = (47191.74 + 47293.25) / 2 = 47242.50
- Price Close
Close = (Open + High + Low + Close of the current candle) / 4
The close price of the Heikin-Ashi candle requires the entire price movement of the current candle. The most important factor here is that, to formulate Heikin-Ashi close, the candle export data from the traditional candle.
For example, you can see that the below figure.
Heikin-Ashi Price Close illustration
BTC/USDT| 05m | tradingview.com
Open price of current candle = 47155.09
Close price of current candle = 47251.68
High of current candle =47273.07
Low of current candle = 47073.21
Price Close = (47155.09 + 47273.07 + 47073.21 +47251.68) / 4 = 47188.26
- Price High
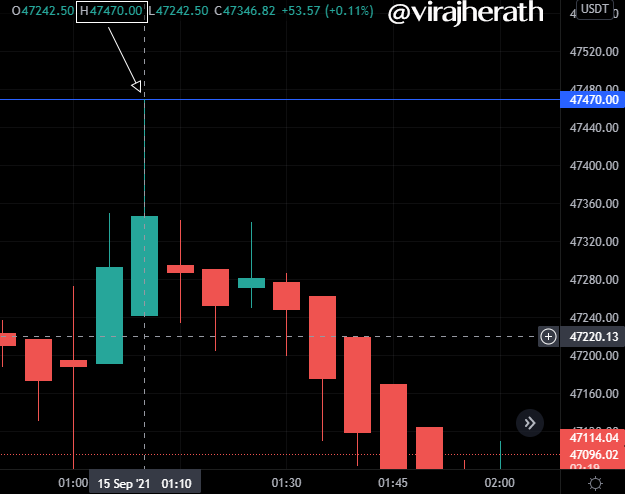
High = Maximum value of the (High , Open , Close of the current candle)
There won't be any calculation for this, the highest price value among high, open and close values of current Heikin-Ashi candle time period will consider as the High of Heikin Ashi.
Heikin-Ashi Price High illustration
BTC/USDT| 05m | tradingview.com
- Price Low
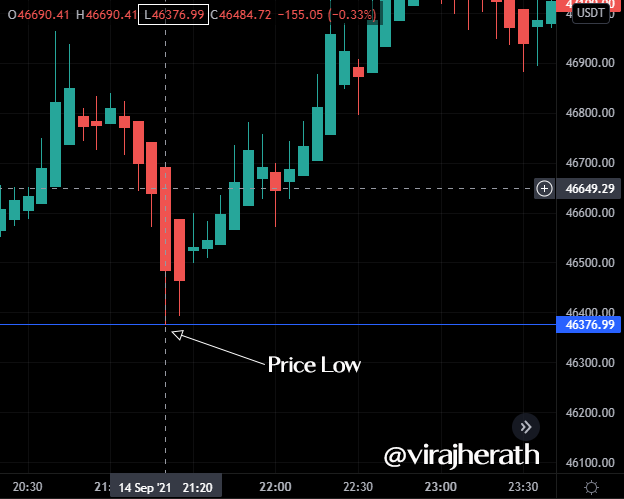
Low = Minimum value of the (Low , Open , Close of the current candle)
There won't be any calculation for this as well, the lowest price value among low, open and close values of current Heikin-Ashi candle time period will consider as the Low of Heikin Ashi.
Heikin-Ashi Price Low illustration
BTC/USDT| 05m | tradingview.com
Graphically explain trends and buying opportunities through Heikin-Ashi Candles
- Indecision candle change colours
One of the basic technique would be to wait for the Indecision candle with a colour change. This indicates potential trade reversal and trader can assume that he is entering the market at the earliest point.
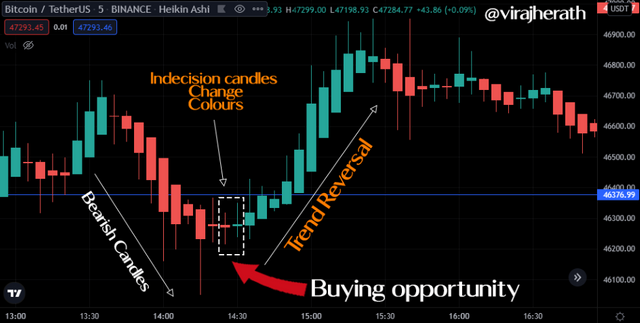
Buying opportunity with Heikin-Ashi candles
BTC/USDT| 05m | tradingview.com
In above example, we can see that there was a downtrend momentum and then there were a few indecision candles appeared in current momentum - red colour (bearish candles). Then the Green colour indecision candle appeared. This is where we have to enter to the market and look for the buying opportunities. Most of the time the trend will reverse from this indecision candle.
- Price pull backs on a trending market
When we see clear bullish market with series of higher highs and higher lows, we can wait for the pullback signal. This again will have a colour changes to the current trend and possible resumption of the uptrend. In case if we see the colour changes back to the bullish candle we can assume the trend is about to continue and enter to the market.
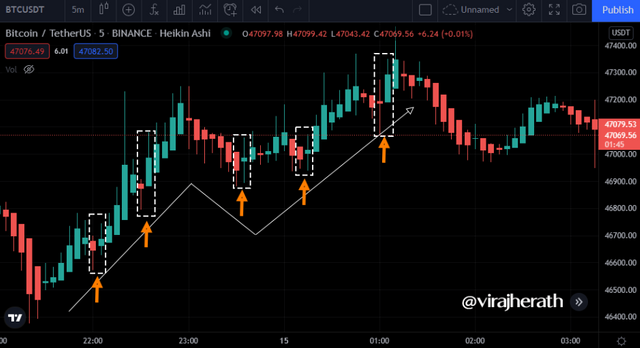
Buying opportunity with Heikin-Ashi candles
BTC/USDT| 05m | tradingview.com
We can see in above figure there are multiple occasions with colour changes / price corrections to the current trend. However, next bullish candle (green candle) signals possible trend continuation and this could be a perfect time to catch the on going uptrend.
Is it possible to transact only with signals received using the Heikin-Ashi Technique?
Well, Heikin-Ashi represents an easy alternative to the traditional candlestick chart. It will give more clarity to the chart and indicate more buying opportunities. However, it is not advisable to use just a simple strategy like Heikin-Ashi technique in your trading decisions.
Possibly there can be certain success when we apply the techniques correctly, but to back our decisions, we should always get the confirmation from some other indicators too. Almost all indicators can be combined with Heikin-Ashi in order to get a clear picture of the market. MAs, EMAs, MACD & RSI are some of the often used indicators with Heikin-Ashi.
No matter how many indicators we use, we have to note that cryptocurrency market is extremely volatile and non of strategy would give 100% success every time. It is very important to manage your risk while trading.
By using a Demo account, perform both Buy and Sell orders using Heikin-Ashi+ 55 EMA+21 EMA.
- Trade 01: BUY ORDER
I have used 03 min time frame for BNB/USDT pair on Trading view with the 1:1 risk reward ratio for my first trade.
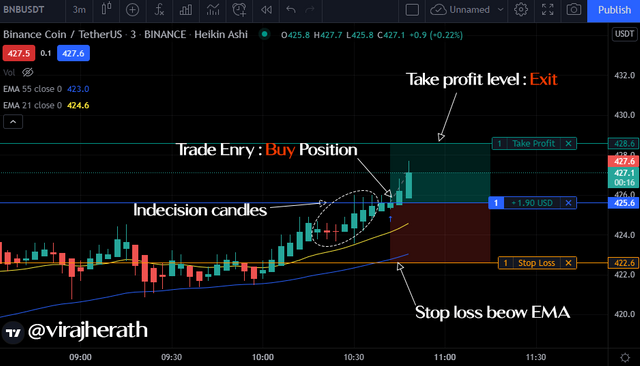
Buy trade entry: Binance BNB/USDT 03 Min chart
BNB/USDT| 03m | tradingview.com
I made my buying decision after I saw a bullish candle after some indecision candles. To support my decision EMA's were below the price action. I set my stop loss slight below the 55 EMA. The EMA act as a support line for this trade.
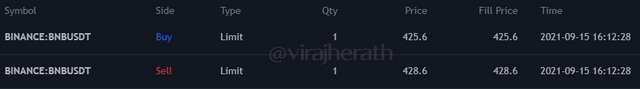
Transaction details of the trade
Trade was successful.
- Trade 02: SELL ORDER
I have used 03 min time frame for XRP/USDT pair on Trading view with the 1:1 risk reward ratio for my first trade.
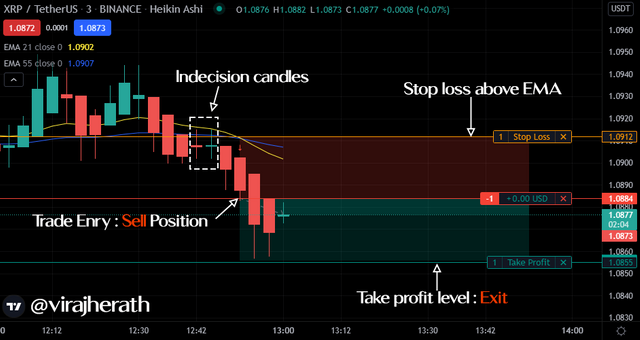
Sell trade entry: Binance XRP/USDT 03 Min chart
XRP/USDT| 03m | tradingview.com
This time I made my sell entry after the first bearish candle prior to two indecision candles. I saw the colour changes on indecision candles, next candle was bearish and EMA's were located above price action made my decision simple. I entered sell position setting the stop loss slight above EMA's crossing. This time EMA's would act as a resistance level.
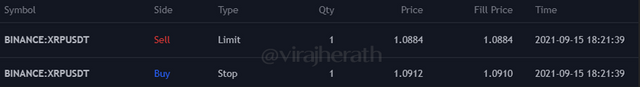
Transaction details of the trade
Trade was unsuccessful as it hit the stop loss level.
Conclusion
The Heikin-Ashi strategy is a powerful and reliable technique to use. We could use this to maximize profits by trading in both bull and bear markets. If you are interested in trying out this strategy, I suggest you start with a Medium time frame trading chart, even though we can use anytime frame for this strategy. The higher time frames will give you more reliable information. For a more successful trade with Heikin-Ashi trading strategy, we can try to predict market movements using other indicators such as EMA's, MA's, MACD & RSI.
I have enjoyed this homework very much. Thank you prof. @reddileep for sharing his trading knowledge with us.