[Recognizing Simple Patterns in Trading] - Crypto Academy / S5W2- Homework Post for @sachin08".

Hello Steemians!
Welcome to the season 5 week 2 of the steemit cryptoacademy. The lecture about "recognizing simple patterns in trading was really beneficial to me. Professor @sachin08 did a very simple explanation in a way we all understood it. This is my entry for the task.
1.WHAT IS YOUR UNDERSTANDING ABOUT TRIANGLES IN TRADING. EXPLAIN ALL FORMS OF TRIANGLES IN YOUR OWN WORDS. (SCREENSHOT REQUIRED)
First of all, i will first explain what i understand by triangle in trading before moving to the forms of triangles. Lets go!
In trading, most traders makes use of triangle in technical analysis i.e they use it to predict what market will tell in future or time to come.
In a clear explanation, triangle in trading are technical analysis which traders make use of to make a good entry or existing point, which are drawn with two trendlines. Some may be asking how traders make use of trendline to draw triagle in order to know the entry and exist point.
Well, in a market chart, they can either draw the straight trendline above the chart that performs the role of resistance level or point and then draw an upward moving line below the chart, which performs the role of support level or point. Therefore, if these two lines meets together, it will create a triangle. When a trader do this analysis, he is predicting that the market will trend up (bullish movement)
On the other hand, a straight line can be drawn under the chart thst performs the role of support level or point and then drew a downward moving line above the chart which perform the role of a resistance level or point. Therefore, if the two line meets together it creates a triangle. When a traders do analysis he is predicting that the market will trend down (bearish movement)
FORM OF TRIANGLE IN TRADING
- Symmetrical Triangle
- Ascending Triangle
- Descending Triangle
I will explain each one after the other and provide screenshot to show how it looks like.
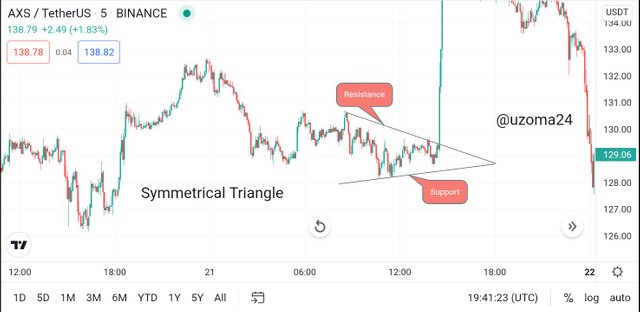
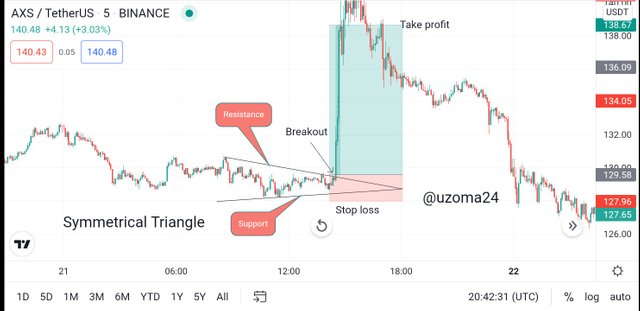
SYMMETRICAL TRIANGLE÷ This is a type of triangle pattern in trading are mostly used by traders to predict the market price. It consist of two different trendline, the one moving downward, that is placed above the chart and thr one moving upward that is placed below the chart. The line at the top serve as a resistance level and the line below the chart serves as a support level. When the two line meets together, it forms a triangle and in this type of pattern a breakout can occurs among the two lines, then traders will take their entry. Below is a screenshot of symmetrical Triangle.
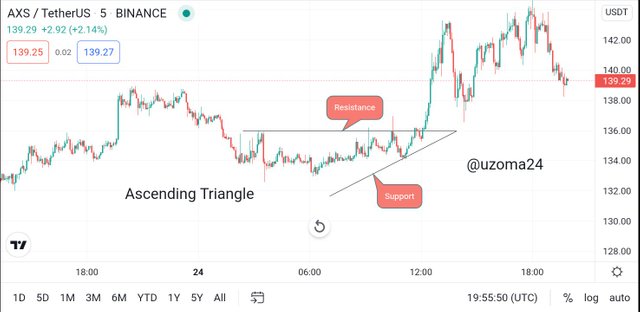
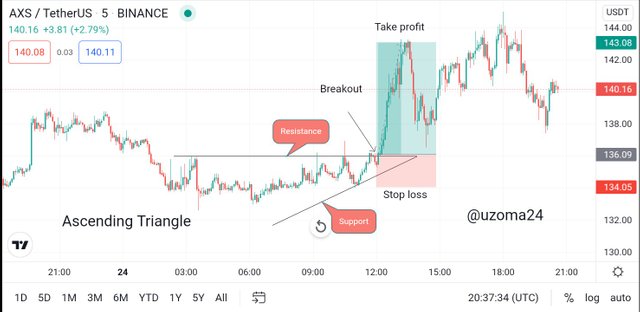
ASCENDING TRIANGLE÷ This is a type of triangle pattern in trading, most traders use it to predict the market movement. It consist of two different trendlines, the one on a straight line that is placed above the chart and the one moving upward that is placed below the chart. The line at the top serves as resistance level and the line below servers as support level. When the two lines meet together, it forms a triangle and in this type of pattern, when there is a breakout in the resistance level, this indicates that there will be a bullish movement
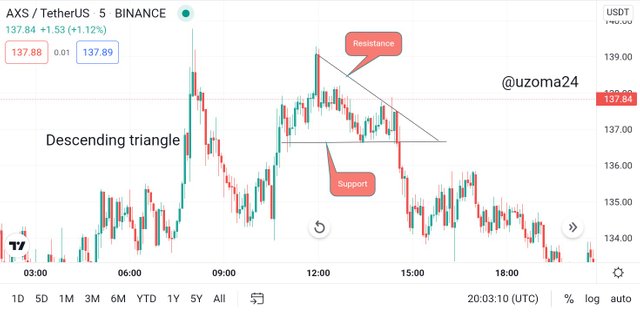
DESCENDING TRIANGLE÷ This is a type of triangle pattern in trading, most traders use it to predict the market movement. It consist of two different trendlines, the one on a straight line that is placed under the chart and the one moving downward that is placed above the chart. The line at the top serves as resistance level and the line below serves as support level. When the two lines meet together, it forms a triangle and in this type of pattern, when there is a breakout in the support level, this indicates that there will be a bearish movement
2.CAN WE ALSO USE SOME INDICATORS ALONG WITH IT TRIANGLE PATTERNS? EXPLAIN WITH SCREENSHOTS.
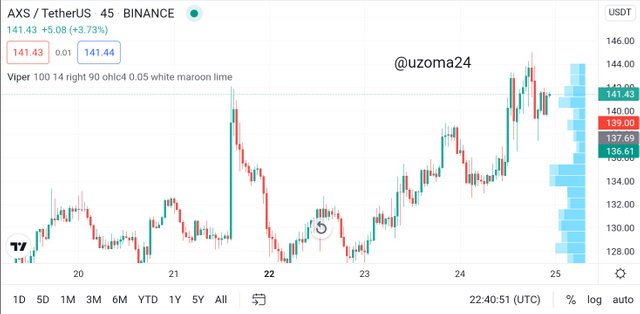
Visible range is also known as the VPVR. This is a powerful indicator and you can use this in any time frame. What this indicator does, is that ut actually gives you a level on the chart where most of the trading action has taken place, how many buy and sell orders have talen place on a specific level and it gives you actually a volumee to show you how much volume has been played out on each specific price level. The reasoni like this indicator is, you can use volumes but volumes doesn't actually give you a level or a price. I actually do trade horizontal, like one of my main trading strategy is actually trading SR flip, so support and resistance is one of my main strategy and the Vpvrt indicator is going to give you a very logical area for where the support and resistance is going to be on the chart.
3.EXPLAIN FLAGS IN TRADING IN YOUR OWN WORDS AND PROVIDE SCREENSHOTS OF BOTH BULL FLAG AND BEAR FLAG.
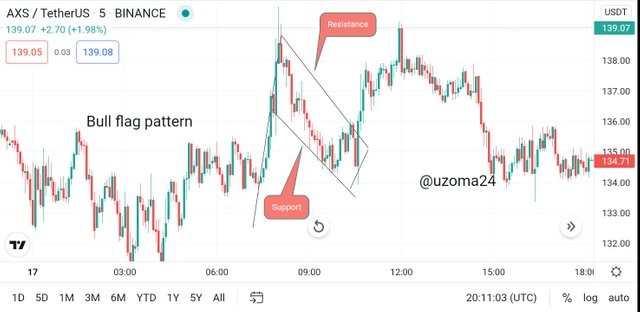
Flag in tradding are technical analysis use by traders to predict the future of the market. It consist of three trendline, the one that is moving upward or downward and the other two forms a ranging market. With all this together, creates a flag. Flag pattern can be either bullish or bearish depending on the price movement.
In bullish flag pattern, you will see an uptrend line, then at the top forms a ranging matket, that is where the support and resistance line are being drawn. See example below
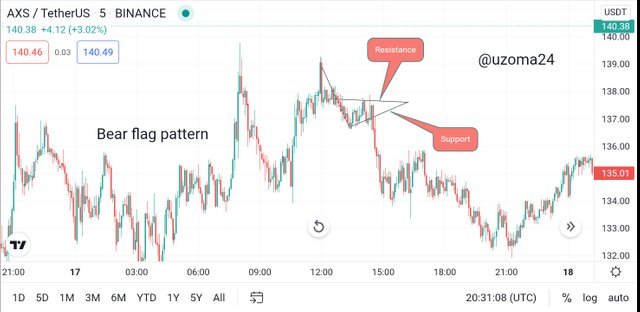
In bearish flag pattern, you will see a downtrend line, then below the charts also forms a ranging market, that is where the two lines are being drawn. See example below.
4.SHOW A FULL TRADE SETUP USING THESE PATTERNS ON ANY CRYPTOCURRENCY CHART. (ASCENDING TRIANGLE, SYMMETRICAL TRIANGLE, BEAR FLAG)
Looking at the chart i provided below, this is an ascending triangle chart pattern that in making this trade as required in the question. As you can see, i have my resistance line, where the price always hits and come back, without cross. The last hit occurs a breakout crosses the resistance level, then i took my entry, set my take profit at the top and then my stop loss below the support level, in case the market reverses back. Once the price hits my take profit, it will then cashout.
Looking at the chart i provided below, this is a symmetrical triangle chart pattern that in making this trade as required in the question. The market was bearish a little but didnt cross the support and resistance level that i set. Now, when it reaches to the breakout point, it tells me that the price will bullish, then i took my enter, setting my stop loss below my entry point and my take profit above the chart. As we can see the market trends up and hits the take profit. See screenshot i provided below.
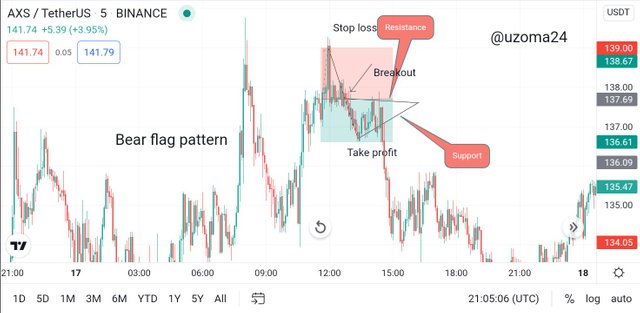
Looking at the chart below, this a bear flag pattern. The market was bearishing a little and i made analysis using the bear flag to know whether the market will bearish more. Because i want to predict that the market will fall, so when the price crosses the breakout, i toom my entry. Now am setting my stop loss at the top of the chart and then my take profit below the chart. This is because am shorting the market price.
CONCLUSION
The lecture was really awesome. With this, i was able to learn how to analyse the market, knowing when to make entry or exist the market and also know some indicators that traders use in preducting future price of the market.
Cc-
Professor @sachin08