[Intermediate Course] Steemit Crypto Academy Season 5 Week 8 | Trading with Ultimate oscillator
Heading - Trading with Ultimate Oscillator indicator.
Hello steemians how are you? I hope you all are doing well and you all are safe and healthy during this pandemic time.
This is the fourth Homework task made by me as a professor in the steemitcryptoacademy and this homework is for the intermediate level students.
So today I will give you a quick review about an indicator named as ultimate Oscillator indicator. This indicator is created by Larry Williams in 1976 and this indicator is considered as game changer in cryptocurrency market. In this post we will discuss about its uniqueness that why this indicator is unique and also we will discuss about its trends, entry and exit points and also we will see how trading become more valuable and easy with this indicator.
Ultimate Oscillator
It is a technical indicator that was created by Larry Williams in 1976. It is used to measure the price momentum of any asset in the Crypto market at different time frames. The reason this oscillator is considered as ultimate oscillator is that this indicator has less volatility and provide less signals as compared to other oscillators that rely on single time frame. Generation of less signals indicate more accuracy while trading. This indicator used at least three time friends in its calculation, the shorter time frame has more wait in calculation while longer has the least weight.
Buying and selling signal using ultimate oscillator depend upon the divergence whether it is bearish divergence or bullish divergence. Buying signal occur when there is bullish divergence and sell signal occur when there is bearish divergence.
Calculation of Ultimate Oscillator
The method used for calculation of ultimate oscillator value is given below. let us try to understand the formula and method of calculation.
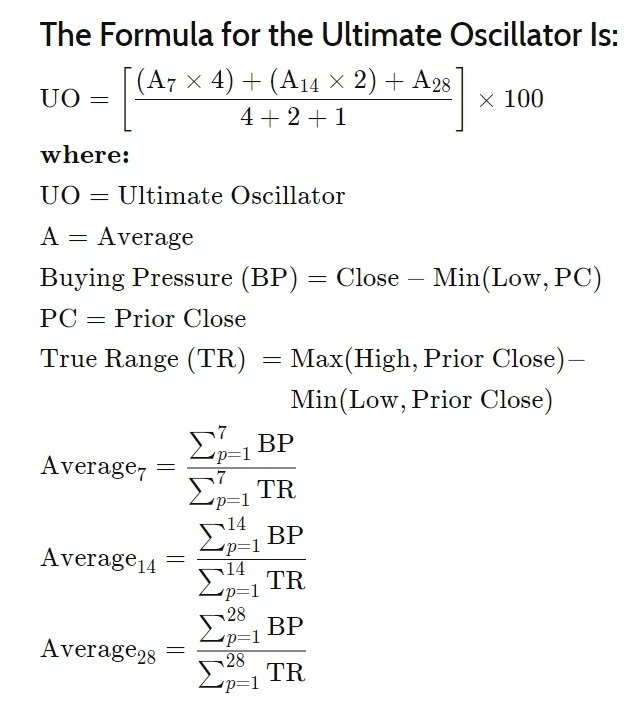
Source
We have to follow the above method of calculation to calculate the value of ultimate oscillator on a particular time frame. First we have to calculate the buying pressure for each 7th period, 14th period and 28th period. Similarly calculate the true range and take the sum for both TR and BP at different periods. No calculate the average value of A7, A14 and A28. So that we can finally calculate the ultimate oscillator value using the formula given above in the screenshot. Its calculation is quite long and will take time to analyse and understand. Use Excel sheet to make complete table while performing calculation of ultimate Oscillator.
Indication of ultimate oscillator
As we discussed above it is a technical indicator and a range bound indicator. Its value fluctuate Between 0-100 level, as similar as relative strength index indicator. Here also we can say above 70 level we enter in overbought condition and below 30 we are in oversold condition. Larry Williams news more than two time frames because in a single time frame false divergence are common using oscillators. So it's better to to use correct divergence for buying and selling trade.
We can use both divergence and non divergence that is overbought and oversold condition to take entry and exit from the market. Let us understand how we can take buy and sell trading signals using Divergence method. William use three step approach method to take entry and exit from the market.
Buying Signal:
In order to take buy trade or or entry in the market we must have to follow few simple steps.
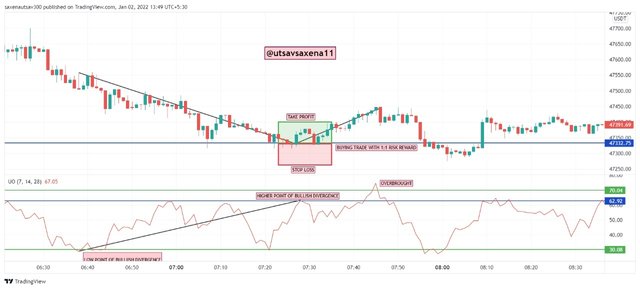
First confirm the bullish divergence in the market that is when price make lower low but the indicator make higher high.
The first lower low in the divergence must be below 30 level that is oversold condition, it indicates that divergence start from oversold condition and will take an uptrend.
The ultimate oscillator must rise above the divergence high that is point between two lows of the divergence.
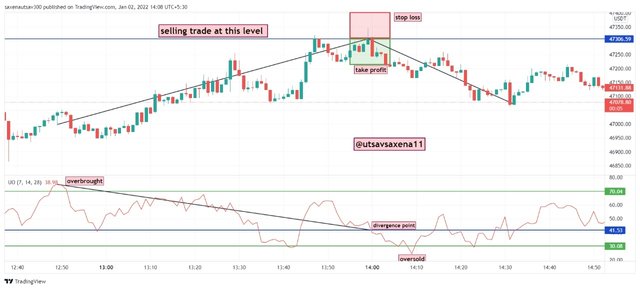
In the above BTCUSD chart of 1 min timeframe you can see that we follow these three steps to take entry in the market. Now you can sell trade in two form whether wait for overbought condition or let the candles hit your take profit level.
Selling Signal:
In order to take sell trade or exit from the market we must have to follow few simple steps.
First confirm the bearish divergence in the market that is when price make higher high but the indicator make lower lows.
The first high in the divergence must be above 70 level that is overbrought condition, it indicates that divergence start from overbrought condition and will take an downtrend.
The ultimate oscillator must drop below the divergence low that is point between two highs of the divergence.
In the above BTCUSD chart of 1 min timeframe you can see that we follow these three steps to take exit from the market. Now you can re-buy trade in two form whether wait for oversold condition or let the candles hit your take profit level.
This is how we take entry and exit from the market using ultimate oscillator, although this indicator don't provide false signals but to analyse better or best divergence you can use divergence indicator as a signal filter.
identification of trends using ultimate oscillator:
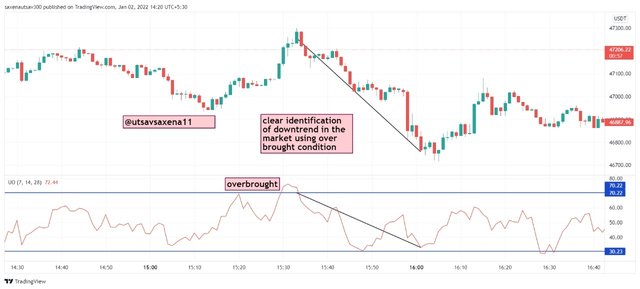
We can easily identify trends whether it is uptrend or downtrend in the market using any indicator. We have already discussed many indicators in which we have overbought and oversold conditions. So to identify uptrend and downtrend in the market using ultimate oscillator is also very easy. When ultimate oscillator is below 30 that is oversold condition it indicates that market will move up and will show up trend in the market. Similarly when ultimate oscillator is above 70 that is over abroad condition it indicates that market will move down and will show down trend in the market.
These are the two basic steps to analyse uptrend and downtrend in the market. Once we analyse uptrend and mounted in the market we can also take buy and sell Trades at these two levels.
Let us take an example of downtrend in the market using ultimate oscillator.
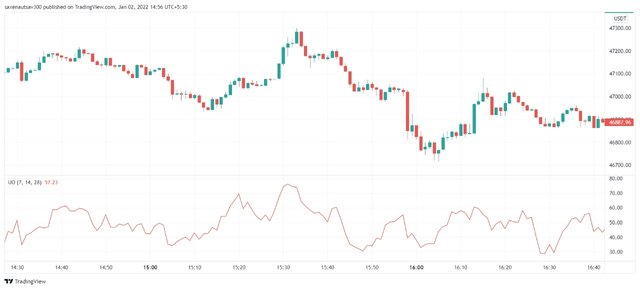
As you can see in the above btcusd chart of 1 minute time frame that it after over what condition we can see Sharp fall in ultimate oscillator which clearly for downtrend in the market in the candlestick price chart also. With the same technique we can also identify the actor and in the market with the oversold condition that is below 30 level.
limitations of ultimate oscillator:
The main limitation of this indicator is that sometime it provide poor trades and neglect out the trades which are good and perfect. At every price reversal divergence is not present so it's important to use another indicator aur divergence indicator to analyse divergence in the market, otherwise one can take over brought and over sold condition for entry and exit from the market.
To use ultimate oscillator one should have good knowledge of divergence, three step approach and how to identify divergence in the market.
Conclusion:
It is time to conclude our homework post in which we discuss about the ultimate oscillator indicator which was created by Williams in 1976, it worked on the same mechanism of relative strength index indicator but use three different time frames for periods for its calculation that is 7 14 and 28 periods. It also create overbought and oversold condition in the market and use three step approach to identify trend in the market or take entry and exit from the market. We can easily identify trend using overbought and oversold condition in the market that is below 30 level oversold condition will take place and above 70 level overbought condition will take place. This Indicator is quite easy to understand and also basic to analyse.
This homework post is quite tricky but easy, we discuss about ultimate indicator for ultimate oscillator indicator. Now it's time for the assignment questions full stop before submitting your homework post read guidelines carefully. This time you will lose marks only if you did not use text-justify in your assignment.
Assignment:
Question 1:
What do you understand by ultimate oscillator indicator. How to calculate ultimate oscillator value for a particular candle or time frame. Give real example using chart pattern, show complete calculation with accurate result.
Question 2 :
How to identify trends in the market using ultimate oscillator. What is the difference between ultimate oscillator and slow stochastic oscillator.
Question 3:
How to identify divergence in the market using ultimate oscillator, if we are unable to identify divergence easily than which indicator will help us to identify divergence in the market.
Question 4:
what is the 3 step- approach method through which one can take entry and exit from the market. Show real example of entry and exit from the market.
Question 5:
What is your opinion about ultimate oscillator indicator. Which time frame will you prefer how to use ultimate oscillator and why?
Question 6:
Conclusion
Real examples required screenshots while performing trades.
Homework Rules and Guidelines
Read all the given guidelines and instructions carefully.
Homework assignments must be posted in the community Steemit Crypto Academy.
THERE WILL BE NO APOLOGY FOR PLAGIARISM IN STEEMITCRYPTOACADEMY.
According to the latest rules, only people who are actively participating in the #club5050 are eligible to take part in Crypto Academy homework assignments. check your eligibility before uploading the homework post. #club5050 status (last one month) is a prerequisite to participating in this homework task. The minimum threshold for Club5050 is 150 SP power up in the last one month regardless of the payout and earning. This is applicable for both active and inactive users. The upper threshold is subject to your cashout and earning for the specified period(i.e. last one month).
Post title must be written in the format "Ultimate oscillator indicator- Steemit Crypto Academy- S5W8-Homework post for @utsavsaxena11. "
The minimum reputation to take this class is 60.
The minimum Steem Power that must be owned is 600 SP. (Not including delegated)
Accounts that are powering down are not allowed to take this class.
The minimum number of words in the post is 500 words.
Use images that are Copyright-free and list the source of these images.
All screenshots taken must be given a watermark that includes your username.
Put the tag #utsav-s5week8, and #cryptoacademy in the first 5 tags of the post.
User must include their respective country tags in the homework assignments.
Do proofreading before uploading your homework post and check tags 2-3 times.
Put the task link in the comments column if it has not been rated for 2 days or more.
Justifying the text is necessary and the users from India are requested to add #India as one of the tags.

All these guidelines will effect your marks in presentation and originality. So read it carefully. If you don't use your country tag before submission Then 100% you will loose marks.
If you have any doubt in the assignment given, feel free to ask it in the comment section below.
Homework assignments deadline is until January 8th 2021 at 23:59 UTC.


ALL THE BEST...
Great lectures professor. Please I don't understand one thing here, please what do you mean by we should show real examples? Does that means we should carried out real trading? Or real examples on a demo trading account
Real example in Calculation means Complete calculation by taking real values from any chart then find exact or near value of ultimate oscillator. Real charts basically means asset examples. No real or demo trade required.
Okay professor thanks for the urgent reply and clearifying my doubts. Looking forward in submitting my assignment soon
There are some typo errors in this post ...prof should proof read this post and make necessary corrections.. understandable lecture though..
Let me just go through it...and please mark my mistake too.. thankyou so much for your comment.
Honestly can't wait for Ur correction
Buenos días profesor, interesante conferencia, estoy realizando los calculos y por eso cambie mi pregunta al respecto. El resultado que me arroja tiene una diferencia al mínima.
El resultado de mis cálculos es de [45.00] y el resultado que observo en Trading View es de [44.58] me pregunto si esta bien tener una diferencia de 0.42 ya que como obtuve los datos de la gráfica, puede que sean algo diferentes con respecto a los datos mas exactos con los cuales el indicador calcula su valor en el gráfico de Tradingview, de todas manera espero su respuesta para reportar así mi resultado.
Y con respecto a la pregunta 5:
¿Se refiere al periodo de configuración o el marco temporal del gráfico?
Espero su respuesta estimado profesor
Yes, 44.58 is correct.
Yes choose any timeframe and explain why you choose that timeframe.
Profesor no entendí muy bien la primera respuesta, mi resultado fue de 45 y el resultado del grafico es de 44.58 ¿Es correcto eso?
Disculpe, creo que con esto del traductor muy poco entiendo @utsavsaxena11
Yes,45 is also correct but mark 44.58 on chart. And calculate percentage error As you have both observed and calculated values.
okeys profesor, tengo otra pregunta pregunta con respecto al paso tres al momento de identificar una señal de venta:
¿a que se refiere con eso de que debe caer por debajo del mínimo que se encuentra entre dos maximos ? podría ser un poco mas explicito por favor? me encuentro un poco confundida con esa teoria en ambas: la señal de compra y la señal de venta, espero pueda responder pronto :c y disculpe la molestia
Consider overbought and oversold condition as two maximum reaching points. You can not move beyond these two points. So consider these two points as maximum. Your chart is kind of correct but your oversold level is at 36 which is not correct. You can take range from 29.5-30.5.
Ahora todo claro estimado profesor, entregaré la tarea proximamente. Disculpe los inconvenientes
HOW DOES ONE GET HIS OR HER BUYING PRESSURE VALUE AND TRUE RANGE
Amigo te recomiendo que vayas a la fuente de la imagen de la formula y sea traducido a tu idioma
BP = CIERRE - MÍNIMO
TR = MÁXIMO - MÍNIMO
Se calcula para cada uno de los periodos y luego se realiza una sumatoria de los periodos 7, 14 y 28
The formula of bp and tr has been given. What you have to do is that take one observation candle. Then calculate average BP and tr of 7,14,28 period candles that is previous candles. Let n be the observation candle then start your calculation for 7 period line from n-1 candle.
Professor please suggest me one efficient divergence indicator, because i am also taking original trades except demo trade.
Also i am preparing my assignment, you illustrated and choose effective Indicator for trading thank you.
Directly use divergence indicator...on trading view...there is no specific divergence indicator. Search divergence indicator on trading view.
Ok professor acknowledged
Buenos días profesor. Ha votado por mi post, pero no me ha colocado la calificación.
https://steemit.com/hive-108451/@leomolina/ultimate-oscillator-indicator-steemit-crypto-academy-s5w8-homework-post-for-utsavsaxena11
Un saludo profesor, mi tarea aún no ha sido corregida:
https://steemit.com/hive-108451/@dairhial07/ultimate-oscillator-indicator-steemit-crypto-academy-s5w8-homework-post-for-utsavsaxena11