Heikin-Ashi Trading Strategy - Steemit Crypto Academy | S4W2 | Homework Post for @reddileep
A common knowledge about crytopcurrency is that fact that price movement is represented on a chart. It is even safe to say that once an individual spots a chart in recent times, such a person quickly attributes of to the crytopcurrency market or foreign exchange as these are the twin most popular sectors that make use of these kind of tools.
Also, many people have come to create a close a connection between the candlestick chart and cryptocurrencies. This chart pattern has been made synonymous with crytopcurrency market. As a result, a good number of people including most novice traders have no knowledge of any other chart techniques associated to the Japanese candlestick chart.
Truly, the Japanese candlestick chart is about the most popular. Obviously, there are lots of reasons for maintaining this top position. However, there are some other types of market price charts techniques that render the candlestick chart in better view. One of them like the Heikin-Ashi chart offer some better prospects as thought by Prof. @reddileep.
Some wonderful insight has been exposed to is about Heikin-Ashi chart technique and this has made this chart technique seem more fun and appealing for traders. Up until now, I had no idea that such a chart pattern was in existence.
Thus, in the sections to follow, I will be giving answers to some questions asked about the Heikin-Ashi chart by Prof. @reddileep

1. Define Heikin-Ashi Technique in your Own Words
Heikin-Ashi chart technique is a type of candlesticks which appear more smoother and straightforward unlike the ordinary candlesticks chart, formed with candlesticks which have connections to one another where the next one is being determined using data from preceding candlestick.
In Heikin-Ashi chart technique, the high, low, open and close prices of the last candlestick are used in representing the succeeding candlestick. Heikin-Ashi trading technique has great similarities to the ordinary Japanese candlestick chart though there are some key differences in appearance and in how the candlesticks are created.
Heikin-Ashi is a Japanese word meaning average pace. This is a technique that have clear display of data in a modified way by smoothening out the level of volatility in a market price and presenting it without injecting a lot of "noise". Heikin-Ashi candlesticks do not change too rapidly with price action but uses some mathematically calculated averages and formula to maintain stability in price charts. Heikin-Ashi chart technique represents an asset's price at the average pace.
Heikin-Ashi trading technique is proposed to have been invented by Munehisa Homma in the 1700s. Munehisa Gonna was a rice merchant from Sakata, Japan. When using this technique, candles with no lower shadow signal a strong bullish trend while candles with no upper shadow or wick indicate a strong bearish trend..
Basically, Heikin-Ashi trading technique is used by chartists as a means detecting trend direction and trend strenght.
An outstanding feature of the Heikin-Ashi trading technique is that candlesticks do not always have shadows on both ends but mostly on one. With this feature one can easily spot which trend the market is going and how strong the trend is.
The major focus of the Heikin-Ashi trading technique is to be able to eliminate irrelevant details from the market price chart. It takes away what is called "noise" and only displays the most stable and dominating market situation. In this way, it displays more consecutive bearish or bullish candlesticks over a particular trend.
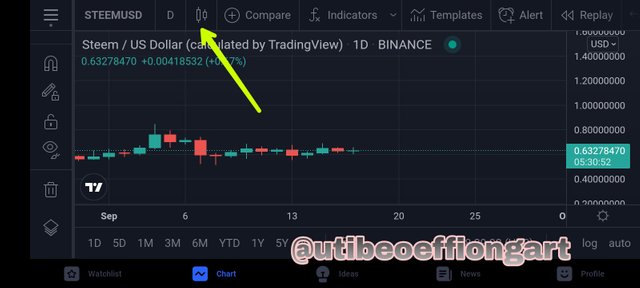
How to Insert Heikin-Ashi Trading Technique
First select a crytopcurrency chart. Then you locate the chart icon as shown above.
Clicking on the chart icon, a list of several chart types will drop down. There, you pick the Heikin-Ashi option which is somewhere below.
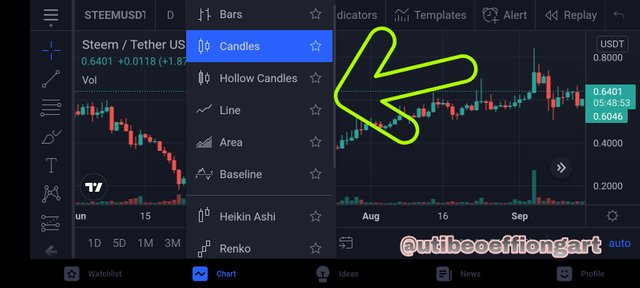
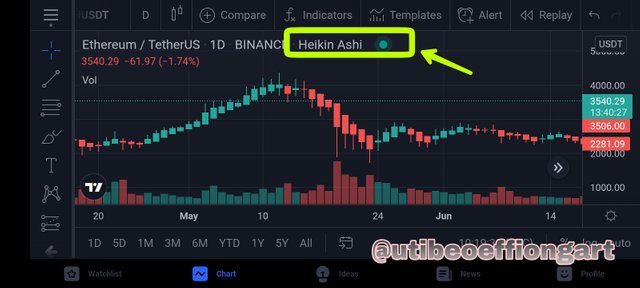
The chart technique will be displayed as shown below.
2. Make Your own Research and Differentiate Between the Traditional Candlestick Chart and the Heikin-Ashi Chart. (Screenshots required from both chart patterns)
From records, it is understood that both the Japanese candlestick chart and the Heikin-Ashi trading technique were developed by the same man. However, these two are not the same even though they have some obvious similarities.
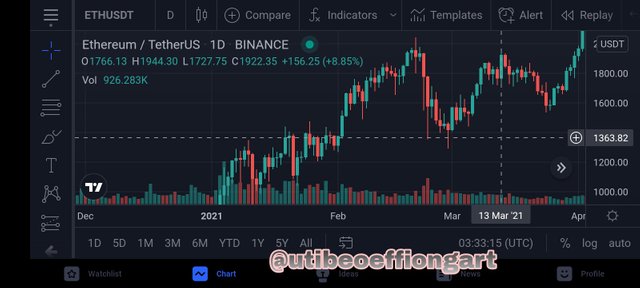
Japanese Candlestick Chart
Heikin-Ashi Trading Technique
There are equally some clear distinctions between these concepts which will be detailed in the table below.
| Heikin-Ashi Trading Technique | Japanese Candlestick Chart |
|---|---|
| Price chart is obtained by using modified formula from two moving averages | Price chart is gotten from the current market situation recognizing the opening, closing, high and low prices of an asset. |
| The candlesticks are linked to one another from previous to current as data from preceding candlesticks are used to calculate the current ones. | There is not connection or relationship between candlesticks. |
| It does not show the prevailing price action and movement whereas, it takes cognisance of the average price behavior | It displays a comprehensive detail of the dynamics of the price of a currency in the most recent time. |
| The chart contains lesser noise and appears smoother. | It has a lot of noise and looks copious and complex. |
| Traders find it easier to read and follow the market price. It is more readable | So much information is heaped into the chart and requires more effort to be able to read. |
| The charts do not indicate rapid chances in price. That is, it shows lesser volatility. | Price charts indicate high volatility as the candlesticks changes immediately in response to the changes in currency price and the level of volatility it has. |
| Heikin-Ashi trading technique takes more time to create candlesticks as they need to be calculated from previous ones. | Candlesticks are formed quicker and faster. |
| There are a great reduction in incidence of false signals. | There are more false signals present in the chart. |
| The technique makes it easier for short time frame traders and scalpers. | Scalping is more difficult because of the high volatility. |
| There are no drastic changes in the color of the candlestick unless a clear change in market trend takes place. | There is quick change in candlestick color immediately there is a change in market condition even within a particular trend. |
| There is high clarity in illustrating market trends and direction. | Market trends and direction are not quite easily detected. |
| Traders obtain more reliable information about the situation of the market trend whether to sustain and ride the train or close and order as the trend is more stable. | Traders may be easily tricked by market conditions to take wrong trading decisions. It is not easy to predict trend behavior. |
| Getting accurate point of entry and exit is more difficult as current price action data is not available. | More accurate entry and exit points can be identified as it contains more current information. |
| Here, there is no inclusion of price gaps as one candlestick is calculated from the other. | There is inclusion of gaps since the candlesticks are independent of the other and this is very useful to traders as vital signals can be gotten from gap levels. |
| Candlesticks do not usually have shadows or wick in opposite direction of the trend unless and a ranging and indecisive condition. | Candlesticks have shadows even in opposite direction to the trend. |
| The averages of the price are taken | There is tracking of every price movement |
These are some of the obvious distinctions between these two concepts.
3. Explain the Heikin-Ashi Formula. (In addition to simply stating the formula, you should provide a clear explanation about the calculation)
In the Heikin-Ashi trading technique, the four key points of a candlestick which are open, close, high and low are calculated using formula. The formula are given this:
- Open of candle: (open of previous bar + close of previous bar) / 2
To get the open price of a current candle in the Heikin-Ashi trading technique, the value of the open price of the previous candlestick is summed with the closing price of the same preceding candlestick and the sump is divided by two.
- Close of candle: (current open + high + low + close) / 4
In computing the value of the close, the open, high, low and close of the current candlestick are added together and the result is divided by four.
- High of candle = the maximum value from the high, open, or close of the current period.
Here, the highest value among the high, open or close of the current candlestick becomes the high of the next succeeding candlestick.
- Low of candle = the lowest value from the low, open, or close of the current period
To obtain the low, the minimum value among the low, open or close of the present candlestick is used.
With these formula, the values of the next candlestick can be calculated.
4. Graphically Explain Trends and Buying Opportunities Through Heikin-Ashi Candles. (Screenshots Required)
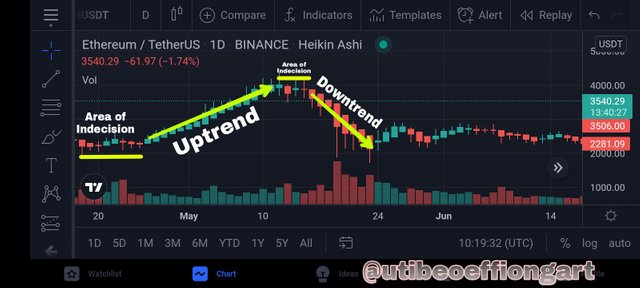
As already discussed in the sections above, one major application and usefulness of the Heikin-Ashi trading technique is the ease with which trend direction and trend strenght can be identified. The candlestick anatomy here, makes it is simply to locate and follow a trend.
Bullish candles are formed with a hollow body and wick or shadow on top.
Hence to have an uptrend or bullish swing, a continuous line of bullish candle is produced. This line has a gradually decreasing upper shadow or no shadow at all.
Bearish candlesticks are filled with lower shadows. A line of continuous filled candlesticks shows a downtrend. A steady bearish movement has filled candlesticks with progressively lower and shorter or absent.
To determine trend’s strength, the proportion of the candlestick sizes can be a clear indication. When a new candle’s body becomes longer than the previous one, this shows that the trend’s strength is increasing. When the candlesticks are progressively getting smaller, it is an indication that the current trend is losing it's strenght and will soon reverse.
Also, another strength determining factor is the length of the shadow or wick. If the length of the wick progressively becomes longer while the body becomes smaller, it shows string opposition to the current trend. If the shadows begin to form on both ends, then the market is entering into a point of indecision.
Thus, when a strong trend is correctly spotted, a trader can decide to ride the trend for as long as the trend persist in momentum.
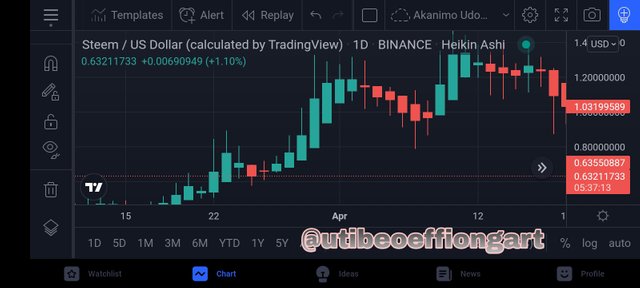
There are some key techniques and tips to look out for when trading the Heikin-Ashi chart. In a case of hollow or green candles without lower wicks,the market is in a strong bullish uptrend.
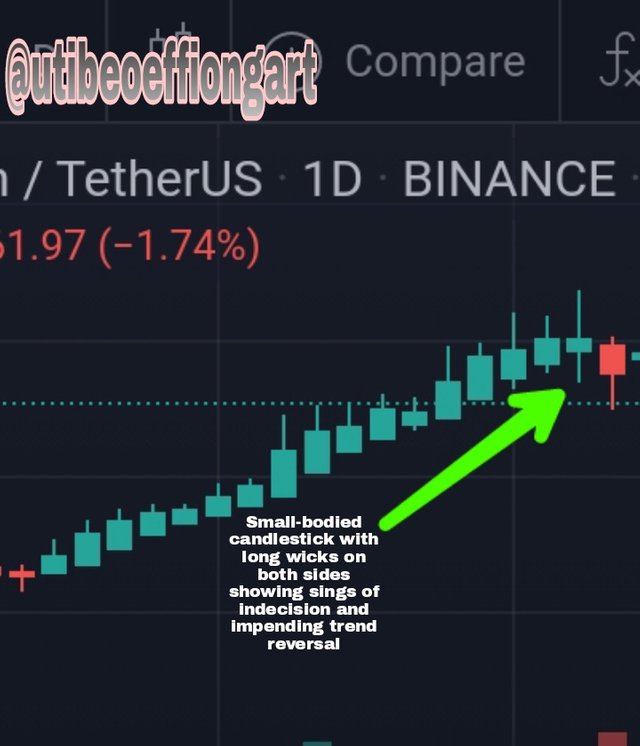
When there are candles with a small body with attached upper and lower shadows, this signals an impending change in current trend. As illustrated below.
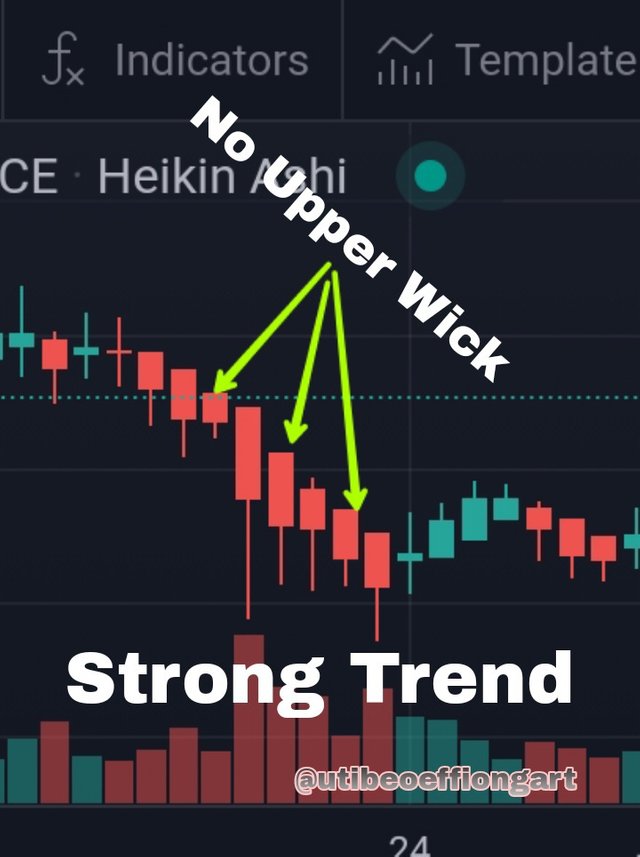
Presence of filled or red candles indicate a downtrend especially when they are in a continuous successive line. If the candlesticks in this trend are without higher shadows, then the trend is strong. As shown below
Market entry with this technique may not be as clear as with the original Japanese candlestick pattern. However, same bullish and bearish candlestick patterns apply some of the most notable ones include the doji, the hammer, cross, shooting star, high wave etc.
If a trend was moving and any of these reversal candlestick patterns are spotted, they might be indicating an impending change in market direction.
Also, whenever the market is ranging or in an indecisive condition and either a typical bearish or bullish candlestick is formed, this might be indicating the commencement of either of the trends. Also, if a series of identical candlesticks form consecutively, then a trader can place a trade.
Generally, trends composed of shaved candlesticks that is, candlesticks with shadows on only one end or very little shadow has higher strength than those with long shadows and wicks on opposite direction. Thus, if the trend is showing great strength, a trader can enter the market in the direction of the trend.
Alternatively, there are reliable technical indicators like moving averages, stochastic osscilators and a couple of others than combined with the Heikin-Ashi trading technique to get higher probability trading decisions.
5. Is it possible to transact only with signals received using the Heikin-Ashi Technique?Explain the reasons for your answer.
The crytopcurrency market is about the most unstable, volatile and risky market to trade in. As such, one cannot be too careful when it comes to taking trading decisions. Thus, is it not advisable to rely solely on the signals interpreted from the Heikin-Ashi trading technique as basis for taking trades.
Though the Heikin-Ashi trading technique offers some level of confirmation and stability, it will be unwise for a trader to depend entirely on the information from the technique for trading.
Thus, talking about possibility, one can base trading strategy on the Heikin-Ashi technique, but in light of risk management, increased probability and profitability, experience and tactics, a trader need a combination of other trading tools.
It is advised that higher time frames be used in conducting market analysis as it offers better coverage and more complete picture. Some limitations of the Heikin-Ashi trading technique such as the absence of gap levels, the lagging nature of the chart, the absence of immediate price action and movement, absence of all price data suggest a need for it to be combined with other technical indicators.
Ordinarily, deciding entry and exit points with Heikin-Ashi trading technique is a bit difficult, but with the presence of technical indicators, this can be made much easier.
6. By Using a Demo Account, Perform both Buy and Sell Orders Using Heikin-Ashi+ 55 EMA+21 EMA
In order to be able to perform this task, I needed to insert the necessary indicator into my chart.
So, I located the Indicators button on my chart.
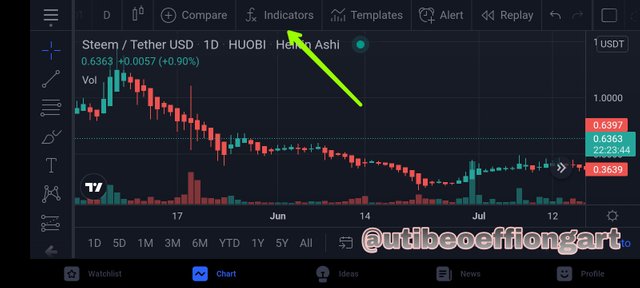
I clicked on it and a list of indicators dropped down.
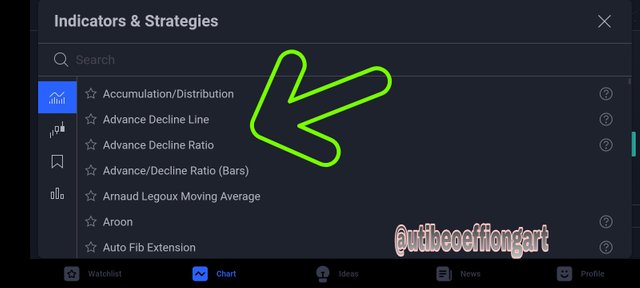
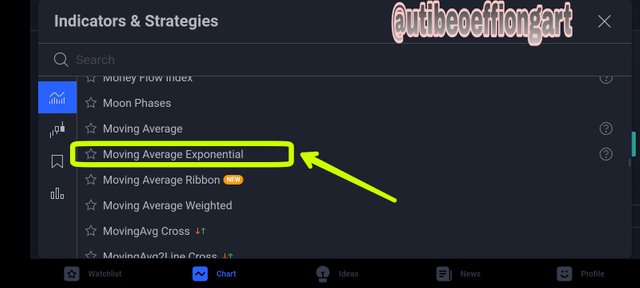
I swiped down to find the exponential moving average. I tapped on it twice since I needed two lengths of the EMA to appear on my chart.
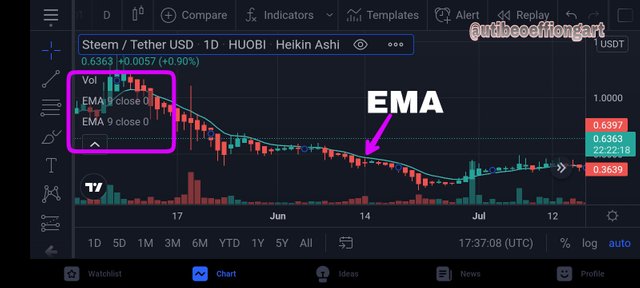
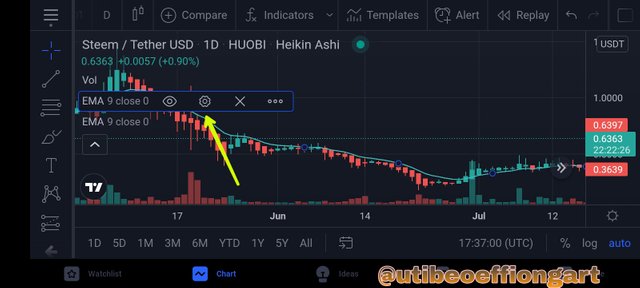
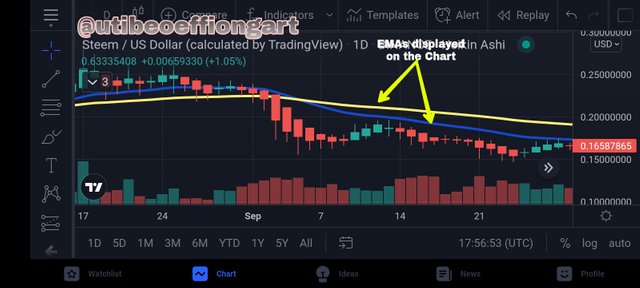
The EMA line was displayed on the chart along with the icons.
I tapped on the icons so as to get to the settings menu.
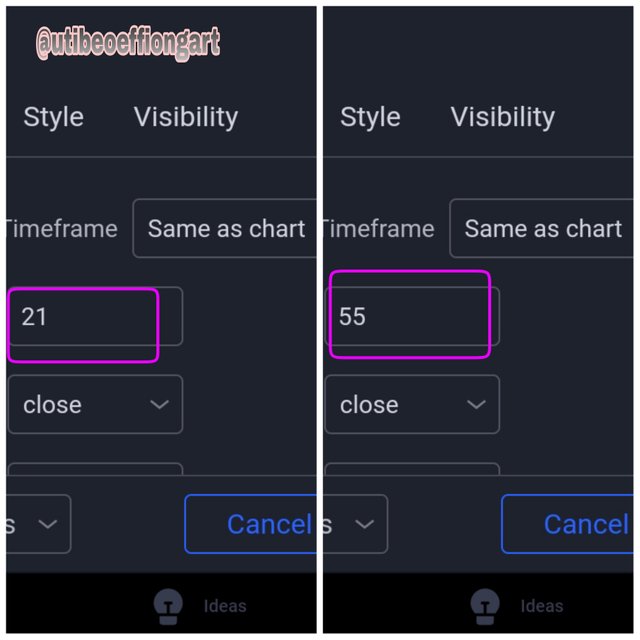
Here, I typed in the different lengths of the EMAs as desired. In this case 21 & 55.
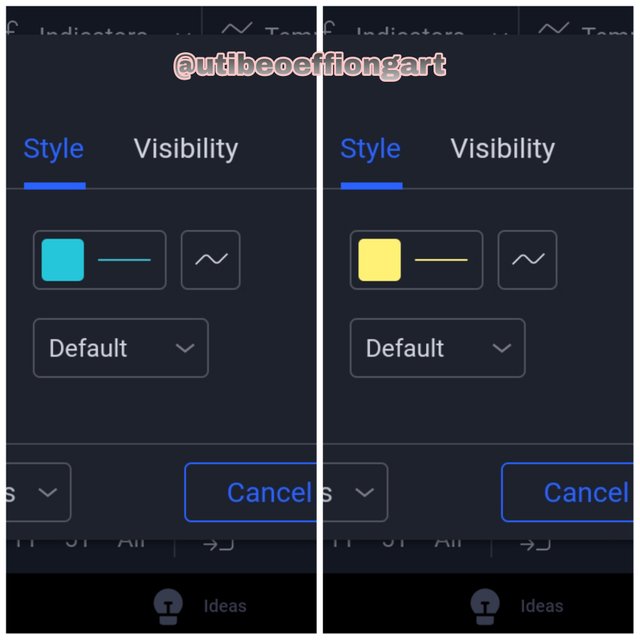
I selected the colours I desired for the EMAs.
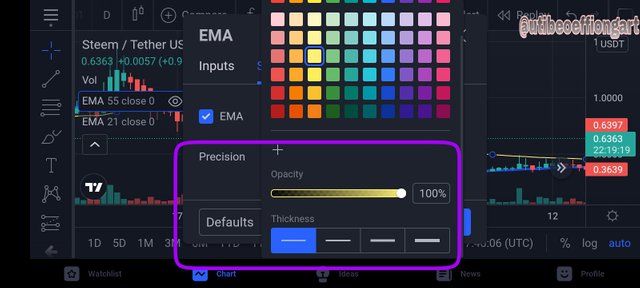
Still on the Style menu I selected how thick i wanted the EMAs to be.
This is how the EMAs were displaying on the chart after set up.
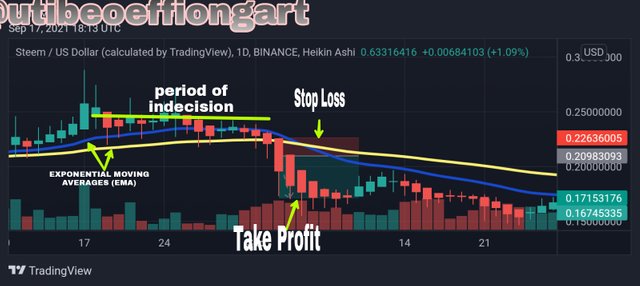
I was not set to proceed to taking trades. The first trade I took was a buy trade as explained below.
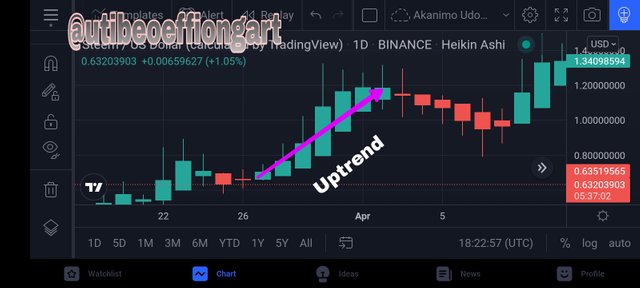
Looking at the chart, I was able to spot an uptrend which started from the point of the doji candle after a little period of indecision.
My entry trigger for the trade were;
- The appearance of the red doji sign which indicated a potential change in trend.
- The development of the succeeding candlestick into a bullish candlestick.
- The appearance of the price bars above the EMAs
The trend looked healthy and strong as majority of the candles had wicks only on the upper part and their sizes was progressively increasing.
I took the trade with a loss to profit ratio of 1:2, setting my stop loss and take profit accordingly.
I placed my stop loss few pips below the first bullish candle at which point I also entered the trade.
I closed the trade after the price has climbed up close to the point where indecision started setting in. You can see from the bullish candle with shadows on both end and then the doji candle forming next. Signalling an end to the uptrend.
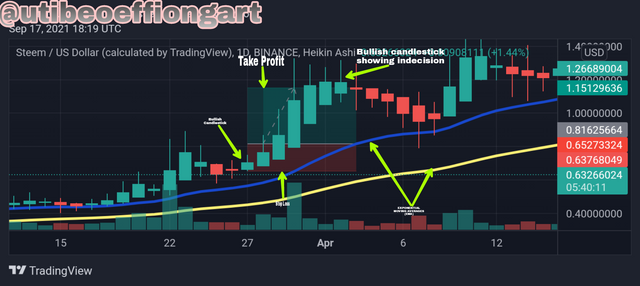
I also took a sell trade. The trade is explained below.
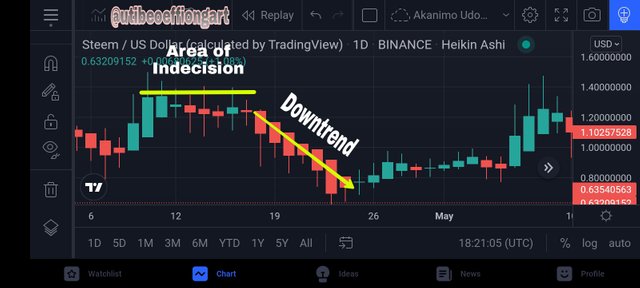
The market had some period of indecision as shown above. However, I spotted a downtrend after this area of indecision. The downtrend was signaled by the forming of a bearish candle.
I decided to enter a sell trade following this trend. My basis for entering the trade include:
- There was a large-bodied bullish candlestick formed after the period of indecision.
- The EMAs were above the candlesticks indicating higher probability of price going down.
- The price had just bounced off the EMAs which at this point serves as a resistance level.
I then decided to ride the trend since it showed high strength as most of the candlesticks only had wicks on the underside.
I closed the trade at the point where the trend began showing signs of reversal - the formation of the small bearish candlestick with wicks on both end and the formation of the doji candlestick.
The trade was taken with a loss to profit ratio of 1:2. Stop loss and take profit were set accordingly. Stop loss was set at the open of the large bearish candle at which point I also entered the trade.
All images for this assignment were gotten from one source
I am tempted to say that the Heikin-Ashi trading chart looks beautiful. Actually, the continuous lines of similar bars with wicks on majorly one side makes the chart look nice with some kind of ryhthymn and rhymes. At least here, there is not abrupt disruption of the flow by candlesticks of different colors unless the trend has real intentions to switch.
Obviously, there many advantages to using this chart technique. A lot of things have been made simpler and easier. Once a good and strong trend can be spotted, a trader can ride it much longer with peace of mind which may not be the case with other traditional charts.
The Heikin-Ashi trading technique takes some ideas from the Japanese candlestick chart. However, they have some outright distinction and disparities. For one, the Japanese candlestick chart lacks the smooth and plain look of the Heikin-Ashi trading technique which makes gives the chart its strong point as traders read it with more ease.
Though there are some deficiencies attributed to this chart technique, on the whole it holds a number of positive prospect for traders. With a wise and diligent application of this chart technique, a trader could enjoy more profitability in the market.