Trading strategy with the VWAP indicator - Crypto Academy/S5W5 - Homework post for @lenonmc21
![Steemit Crypto Academy [Beginners' Level].png](https://steemitimages.com/640x0/https://cdn.steemitimages.com/DQmWHuk8Z7AKG3xxcXbb6kgUfWwANxgDj9h1Liy5Fhx5W87/Steemit%20Crypto%20Academy%20[Beginners'%20Level].png)
Hello crypto enthusiasts, welcome once again to a new week in the crypto academy.
The topic I will be discussing with you today is one of the popular trading strategies known as Trading Strategy with VWAP", the course was tutored by professor @lenonmc2. stay tuned everyone as I submit my warm entry.
Q1 - Explain and define in your own words what the “VWAP” indicator is and how it is calculated (Nothing taken from the internet)?
VWAP is one of the common indicators popular used to display the volume of an asset or let me say it's used to know the level at which an asset is been traded.
The VWAP is an acronym for Volume Weighted Average Price, From the name alone I believe we could figure out what the words mean but let me explain,
The Volume Weight average works in a similar with the Moving average indicator but the difference this has is that it has a volume added to it and as well the result this indicator gives in average.
How does it work?
We all know what volume is, as its the measure or the amount of an asset, so the average works in a sense that this sums the total number of a particular period, literally it sums the total number of buyers and sellers and displays the average result of the outcome, this means we get to be displayed the average market position, which thus proves that we are seeing the average volume at which an asset is been traded first hand.
I believe with the illustration I just made now, even a learned forex trader gets to know what the VWAP means and how it works.
Now to How the VWAP Calculates the result it displayed
The VWAP indicators use three parameters to display their outcome, parameter is;
The Price
Volume at which the asset was traded
Number of candles in each day
So now to the technical part. VWAP =( The Market Price + Volume of traded asset ) / (Candles per day)
let's assume the current market price of a particular asset is $200
Then we have the volume of trade of that asset to be $ 20,000
and the amount of candles in a day for that asset is like 1000
Now the VWAP = ( 200 + 20,000) / 100
VWAP then equals 202.
That is the average volume of that asset in the particular period was 202
Note: These are just based on random numbers calculations which might not be accurate it is just an illustration for the assignment.
Q2 - Explain in your own words how the “Strategy with the VWAP indicator should be applied correctly (Show at least 2 examples of possible inputs with the indicator, only own charts)?
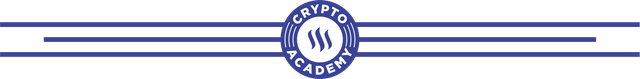
Firstly, let me show you how the VWAP can be properly added to a chart.
- Log on to your trading view, then pick indicator&strategy, afterwards, search the VWAP and click on it to include it in the chart.
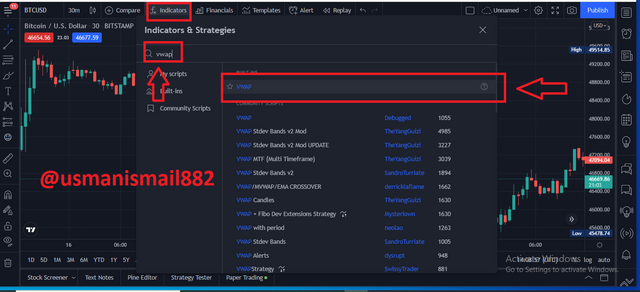
After successfully adding the indicator to the chart, then you click on the settings to have it adjusted to the strategy we will be working with.
1 - Click on the indicator settings.
2 - click on the styles to have them adjusted.
3 - Unchecked the lower band, upper band, and bandbox.
4 - Increase the opacity of the line to have the line displayed in a clearer view.
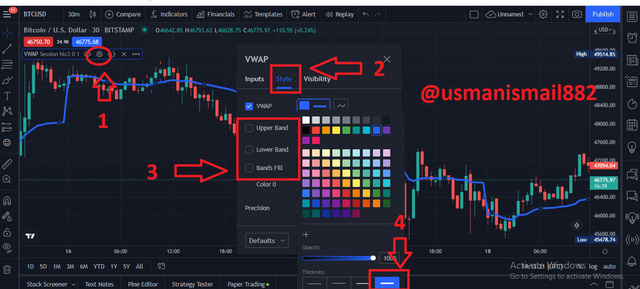
after following the parameters you should have your chart displayed like below;
Now, let me explain the strategy at which the indicator should be followed in other to have it properly applied.
Breakdown of Structure from Bearish to Bullish and Vice Versa
Retracement to the VWAP (Use of the Fibonacci)
Correct Management
These are the parameters to be followed when using the VWAP indicator strategy, let me dive into it quickly as well showing its illustration on the chart.
- Breakdown of Structure from Bearish to Bullish and Vice Versa: Firstly, we look at the last high of the indicator before it breaks to another position to determine what position the indicator takes next, we achieve this by drawing a horizontal line above the last high the market breaks, note that this might be a bullish or bearish break whatsoever, we use this point to determine the strategy at first.
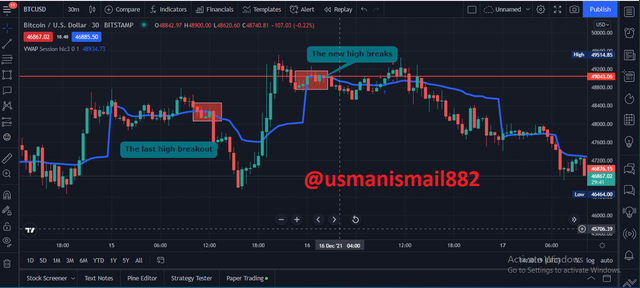
Now from the image shown above, we could see the pattern at which the trends break as we witness a bearish to bullish break. with that, we determine the volume of the market then proceed to the next strategy.
- Retracement to the VWAP (Use of the Fibonacci): Now to include these as well on the strategy, we pick the Fibonacci tool named Gann Box, then we apply it to the chart, we ensure to retrace the level at which the market breaks between the Fibonacci level 0.5 and 6.1.
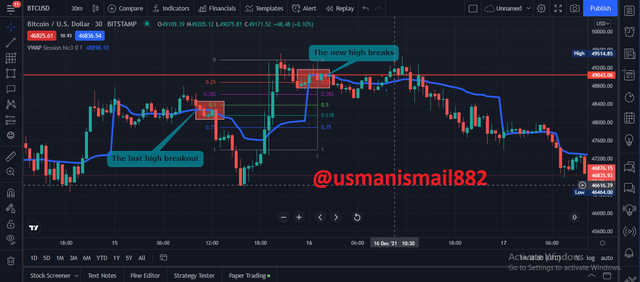
Now from the retracement, we get to see the traces at which the market expands in its Fibonacci form, as we get to see the last high breaks between the points 0.5 and 0.618.
- Correct Management: as we know that setting up a trade without proper management is setting up to a loss, regardless of the winnings the management of a market should always be attended to even if the market is still showing profitability, but the best thing to do is to set little profit so we can make early wins and leave out early on a wreck trade.
To determine our stop loss level, the entry criteria are different for the bullish or bearish market, For a bullish market, A stop-loss order should be placed below the retracement and as well a take profit order is placed above then we can have our risk/reward in 1. 5 difference or at most on a maximum of 2, the case is different for bearish thou, as we place a sell order and a stop loss ahead of the 0.5 - 0.61 retracement, back to a take profit beneath the retracement at most in the ratio 1.25 or maximum 1.5, we could notice there is a difference between the reward ratio, this is to certify traders in as to make little more profit rather than to lose early.
Q3 - Explain in detail the trade entry and exit criteria to take into account to correctly apply the strategy with the VWAP indicator?
There are some conditions termed to be taken into action before considering a perfect entry or exit when using the VWAP Trading strategy, let me explain.
Ensure the break out structure was properly formed, we achieve this by setting up the indicator on the chart, afterward, draw a line level of the last break out, then we determine our break out, a break out can be seen at the point the trend tends to crossover the indicator, we should know that this could happen both ways, it could cross downward which indicates (Exit) or might as well cross upward(Entry).
Secondly we should retrace the element, we achieve these as well by placing the Fibonacci on the part the trends break, we should never forget to place this at the point between 50% and 61.8% to determine the level at which the market might tend to move.
The Take Profit is to be placed above the retracement line as mentioned earlier, we placed this at the top in a buy order above the retracement line, and we as well set the stop limit at the point below the line.
The Stop loss order is to be placed above the retracement level ( 0.5 - 0.61) in a sell trade, this is done to make an early profit, the order at which this is placed is between the reward/risk ratio of 1.25 or 1. 5 to minimize loss and make an early profit as well.
Q4 - Make 2 entries (One bullish and one bearish), using the strategy with the “VWAP” indicator. These entries must be made in a demo account, keep in mind that it is not enough just to place the images of the entry, you must place additional images to observe their development to be correctly evaluated.
Before placing a buy order using this strategy, we ensure that we've witnessed a breakout from bearish first, and as well the market we are considering is currently in a bullish form, afterward, we set up the Fibonacci retracement to determine the market level. let me show you how I placed my buy order.
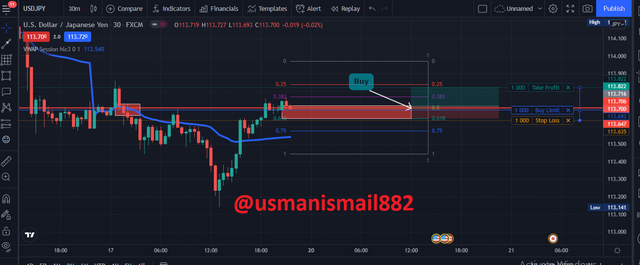
From the trade shown above, we could see how I made entry into the market to buy a unit of JPY coin, it could be seen that the market was trending positively as I have marked the breakout from the previous market, which then I was able to established the retracement line, as well, I execute my trade between the 50% and 61% retracement line.
The trade management was set in the reward ratio of 1 - 1.5, which I did to avoid loss due to the large dip cryptocurrency has been facing lately, this shows a basic strategy of utilizing the VWAP indicator to execute a buy order.
MY ORDER

The image above shows proof of my execution of a unit of JPY coin at the Buy Limit of $113.69
To execute a sell order using the VWAP strategy, we follow the basic steps as explained earlier for a sell order, my exit below.
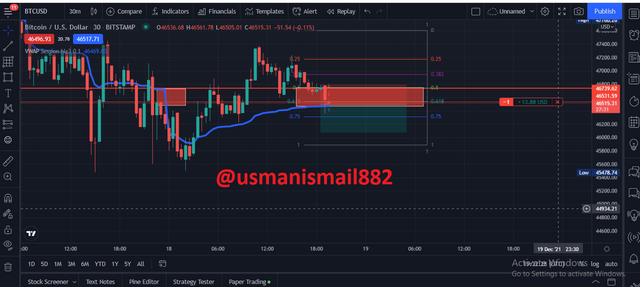
From the image above, we could see how I made my entry to Sell a unit of BTC when the market was trending negatively, as well we could see how the candlestick has been breaking relatively low below the point of the retracement, and as well I set a stop-loss order just above the retracement.
MY ORDER
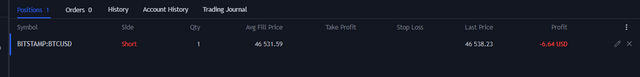
From the image shown we could see the result of my trade execution as the market is already showing a little downtrend which I did use to take advantage to sell as well, the stop loss and take profit was set in the ratio of 1:1 to avoid early loss and as well make an early profit.
The Trading Strategy with the VWAP indicator is majorly used to know the average direction in which a market is currently trending.
The indicator line shows the average position of the market activity, that is, it shows the volume at which a market is trending which thus calculate the volume at which sellers and buyers are dragging a market
Trading with the VWAP is one of the effective tools that can relatively be used to avoid loss and as well make a profit early.
Thank you professor @lenonmc21, its a privilege to participate in your study.