Technical Analysis 2017-08-31
BCH/BTC
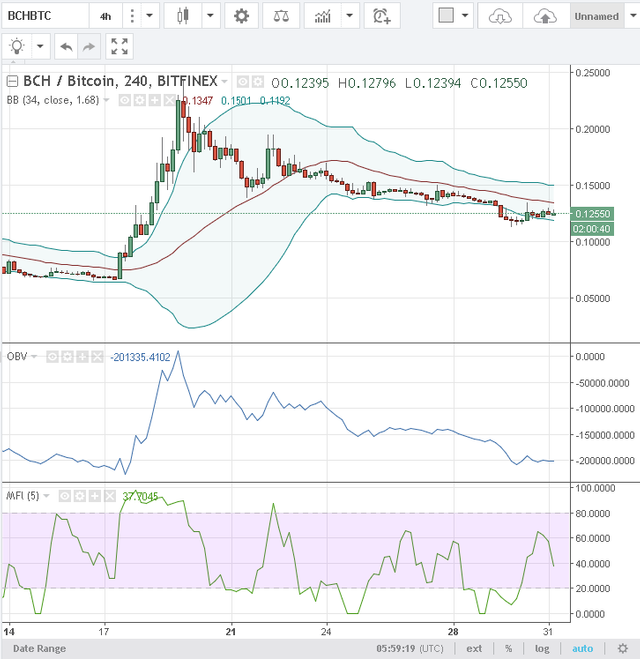
Bitcoin "Crash" is in a steady down trend against Bitcoin. See below for the downside targets. Do not buy unless and until we see signs of bottoming.
Resistance : 0.138500
Down Target 1: 0.098410
Down Target 2: 0.085750
Down Target 3: 0.073090
Down Target 4: 0.033000
BTC/USD
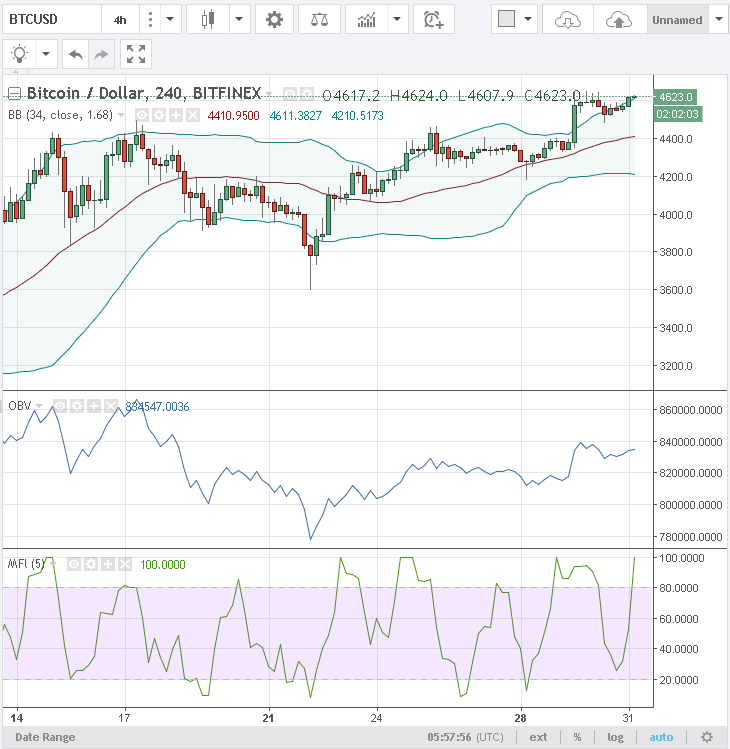
Bitcoin continues its steady rise against the US dollar. It is again overbought, but with no sign of divergence yet. It is probably good for another pull-back and then another wave up.
Up Target 4 : 5318.4
Up Target 3 : 4991.7
Up Target 2 : 4888.6
Up Target 1 : 4733.8
Support : 4458.7
ETH/BTC
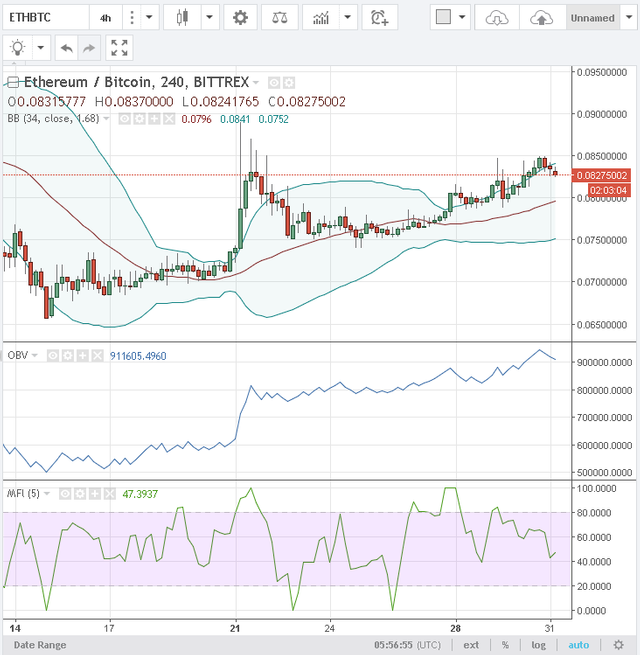
Ethereum is rising steadily against Bitcoin on strong volume. However, if you want to get in, it is ideal to get in when the oscillator is low. However, if you are afraid of missing out, maybe just buy a little. The resistance has not been broken yet. When/if it does, we can look forward to more upside moves.
Resistance : 0.086711
Watch Level 1: 0.078700
Watch Level 2: 0.076170
Watch Level 3: 0.073640
Support : 0.065629
IOTA/BTC
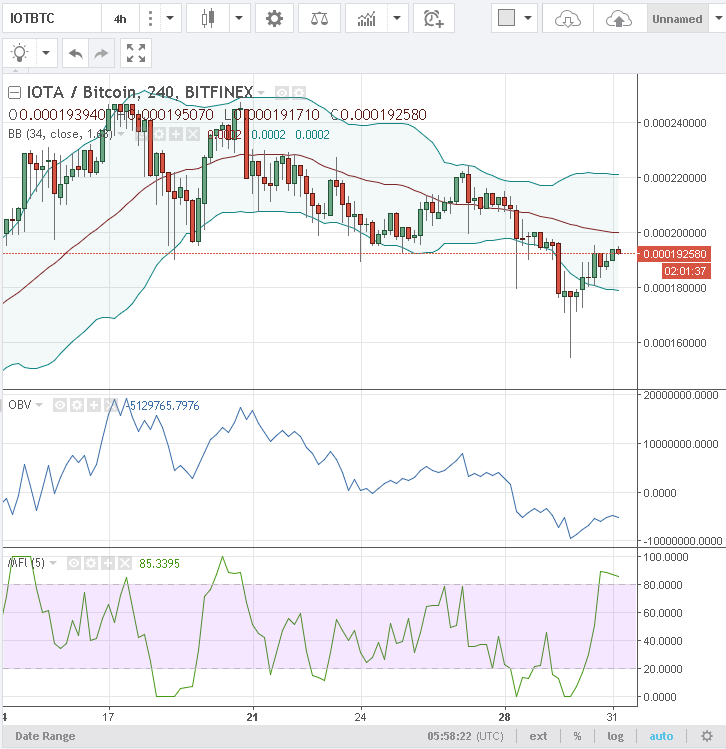
IOTA's down trend against Bitcoin is slowing down. However, it is now grossly owerbought. That means there is a strong potential for a final down move. This is a sell opportunity.
Resistance : 0.0001891
Down Target 1: 0.0001672
Down Target 2: 0.0001603
Down Target 3: 0.0001533
Down Target 4: 0.0001314
Litecoin/BTC
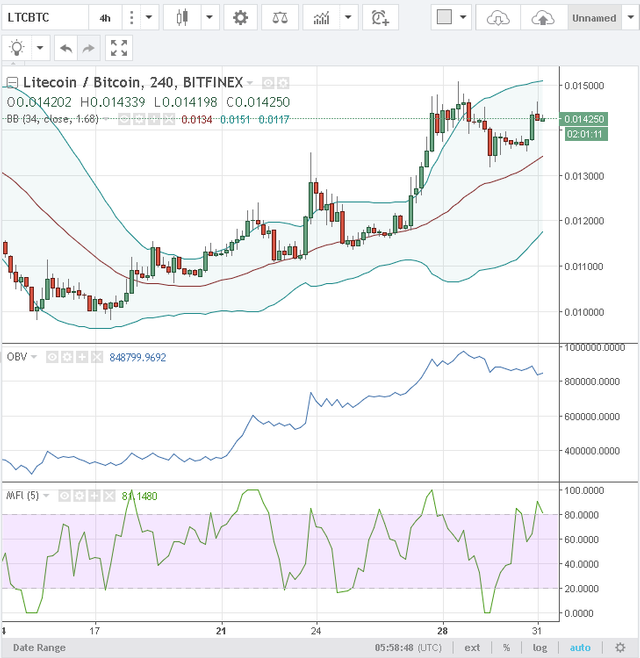
Litecoin had been in a strong up-trend against Bitcoin, but recently there is profit taking. Now it is in an overbought position, but this could be due to sellers pulling their punches rather than buyers desperately pushing the prices up. The Bollinger Bands are narrowing down, which suggest that a consolidation is needed before the next hike.
Up Target 4 : 0.015279
Up Target 3 : 0.014480
Up Target 2 : 0.014227
Up Target 1 : 0.013848
Support : 0.013175
Monero/BTC
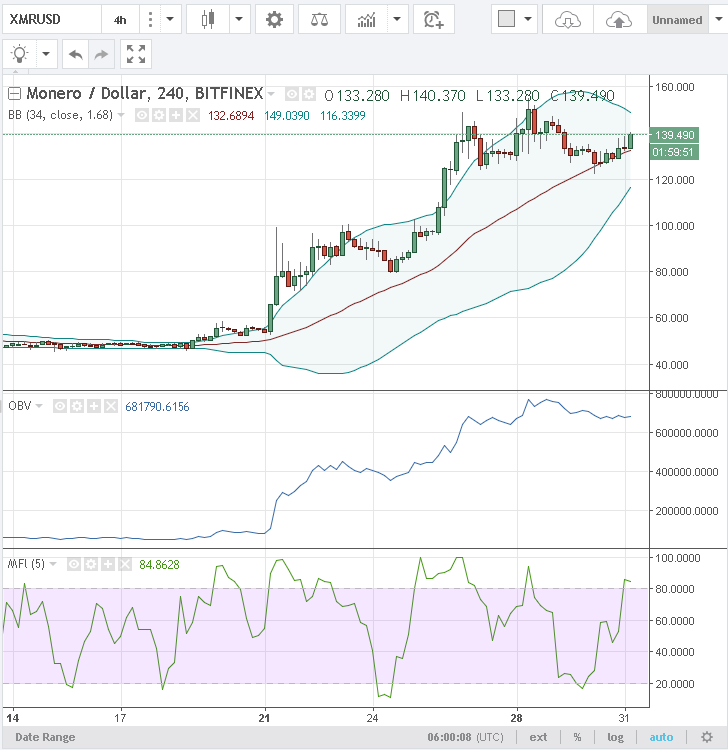
Monero's uptrend against Bitcoin is slowing down. It is overbought, but this could due to sellers not agressively selling instead of buyers being eager to buy. The shrinking Bollinger bands suggests that it is entering a consolidation phase.
Resistance : 0.037980
Watch Level 1: 0.030620
Watch Level 2: 0.028295
Watch Level 3: 0.025971
Support : 0.018610
NEO/BTC
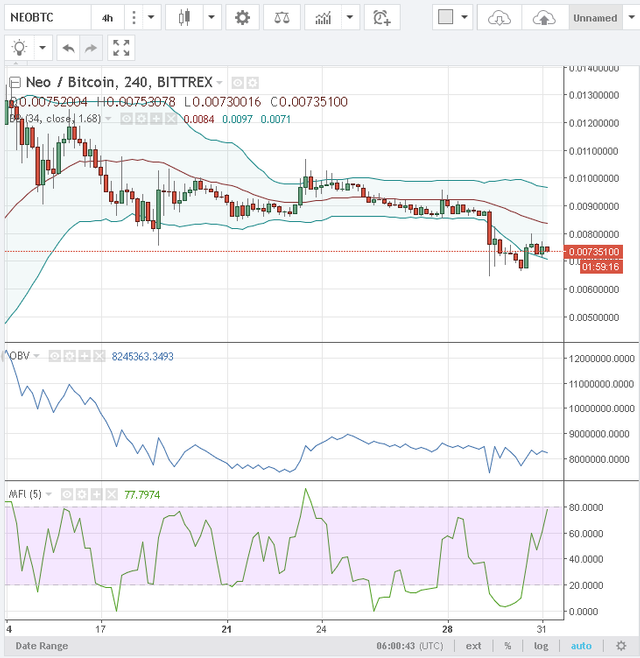
NEO is still going down against Bitcoin. The oscillator is now going for an overbought position. This could be a good selling opportunity.
Resistance : 0.007538
Down Target 1: 0.005090
Down Target 2: 0.004317
Down Target 3: 0.003544
Down Target 4: 0.001096
OmiseGo/BTC
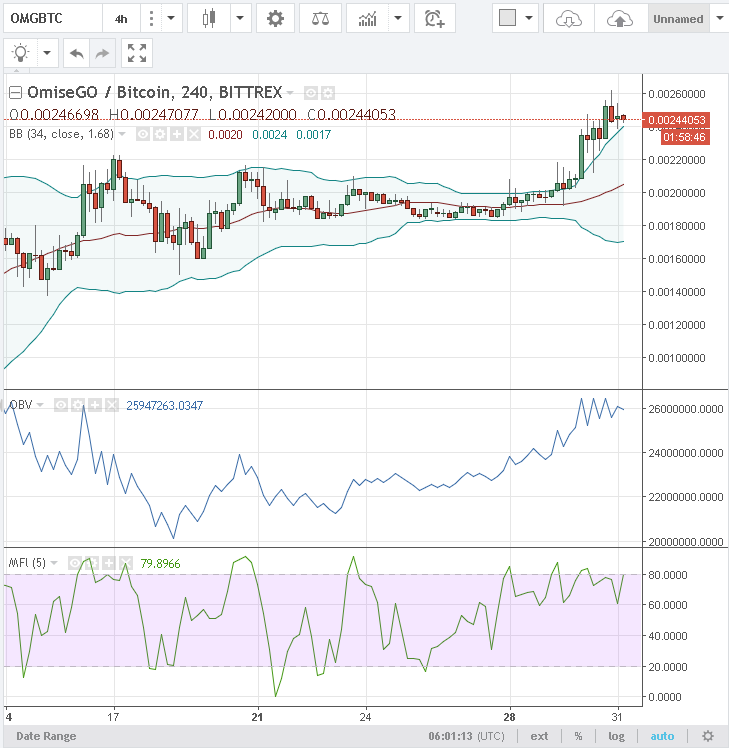
OMG has reached "OMG! OMG!" levels against Bitcoin. However, it is struggling to push even higher as people who bought earlier take profits while new-comers try to get in. Bearish divergence suggests that it may due to a small correction. I still think it is best to wait for the oscillator to come down first. Ideally, prices should go back between the Bollinger bands, near the moving average, which serves as dynamic support.
Up Target 4 : 0.0030788
Up Target 3 : 0.0027545
Up Target 2 : 0.0026521
Up Target 1 : 0.0024985
Support : 0.0022255
Ripple/BTC
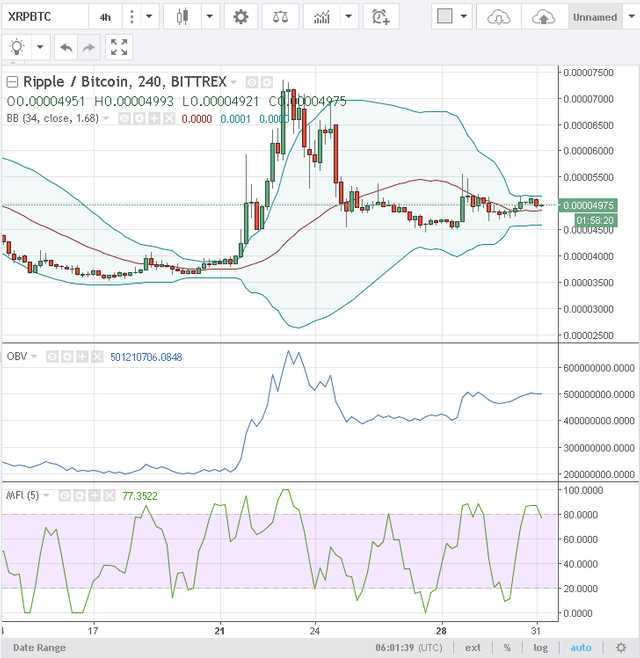
Ripple is still cRIPPLEd, although there has been another bout of "prosthetics" to shore it up. If you think it will turn around, do not rush to get in, because it is now overbought.
Resistance : 0.0000735
Watch Level 1: 0.0000624
Watch Level 2: 0.0000590
Watch Level 3: 0.0000555
Support : 0.0000444
Steem/BTC
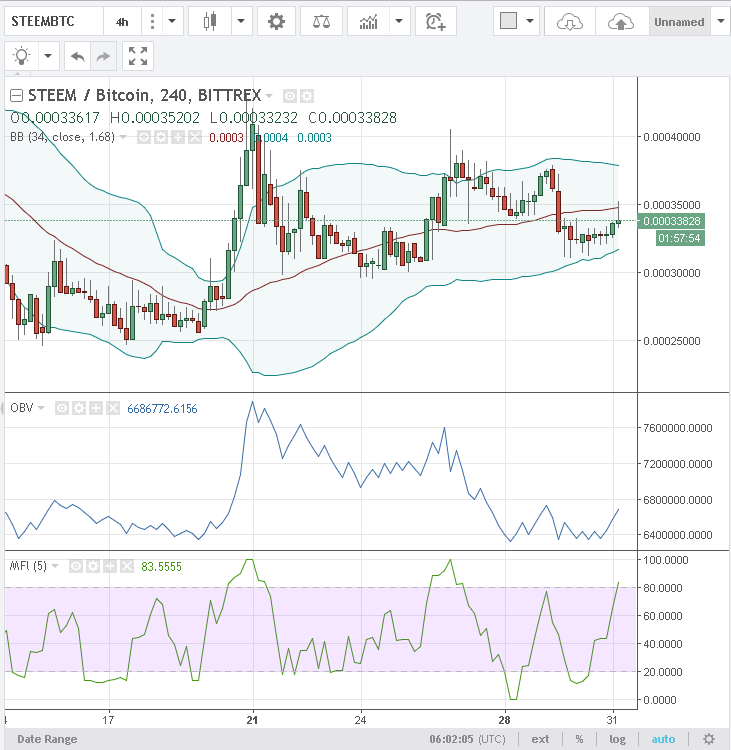
Steem has found more supporters against Bitcoin. But the uptrend is slowing down. Yesterday, I said it could be a buying opportunity for one final quickie push up. Now it has pushed up into the over-bought region. It is time to take profits. There is now bearish divergence. The "buying" volume, though commendable, is not strong enough to beat the previous peak on the OBV. Most likely STEEM will consolidate before deciding its next move (up or down).
Up Target 3 : 0.0005422
Up Target 2 : 0.0005209
Up Target 1 : 0.0004889
Resistance : 0.0004320
Watch Level 1: 0.0003645
Watch Level 2: 0.0003432
Watch Level 3: 0.0003218
Support : 0.0002543
Gold Futures
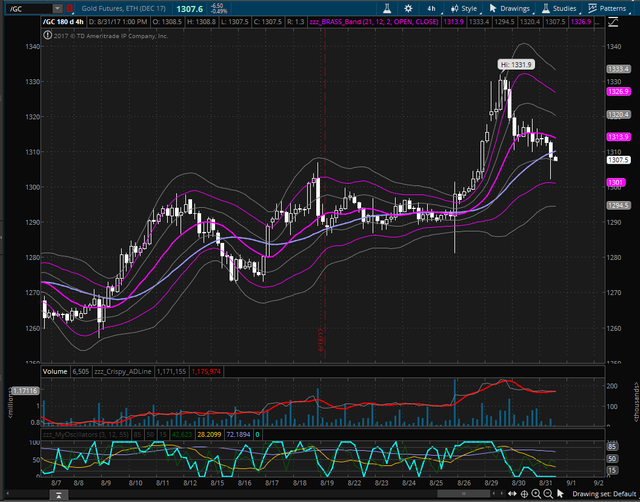
Gold futures has retraced to as low as 1302.3 to test for support. Do you get the funny feeling that Trump and Kim could be doing a double-act to move the prices up and down? It is currently in an oversold condition. Maybe Trump is taking the opportunity to buy now. Then maybe he and Kim will do their snake rattling dance once again. By the way, does anyone know that is happening to the debt "ceiling" on September 30?
Up Target 4 : 1356.7
Up Target 3 : 1337.8
Up Target 2 : 1331.8
Up Target 1 : 1322.8
Support : 1306.9
Silver Futures
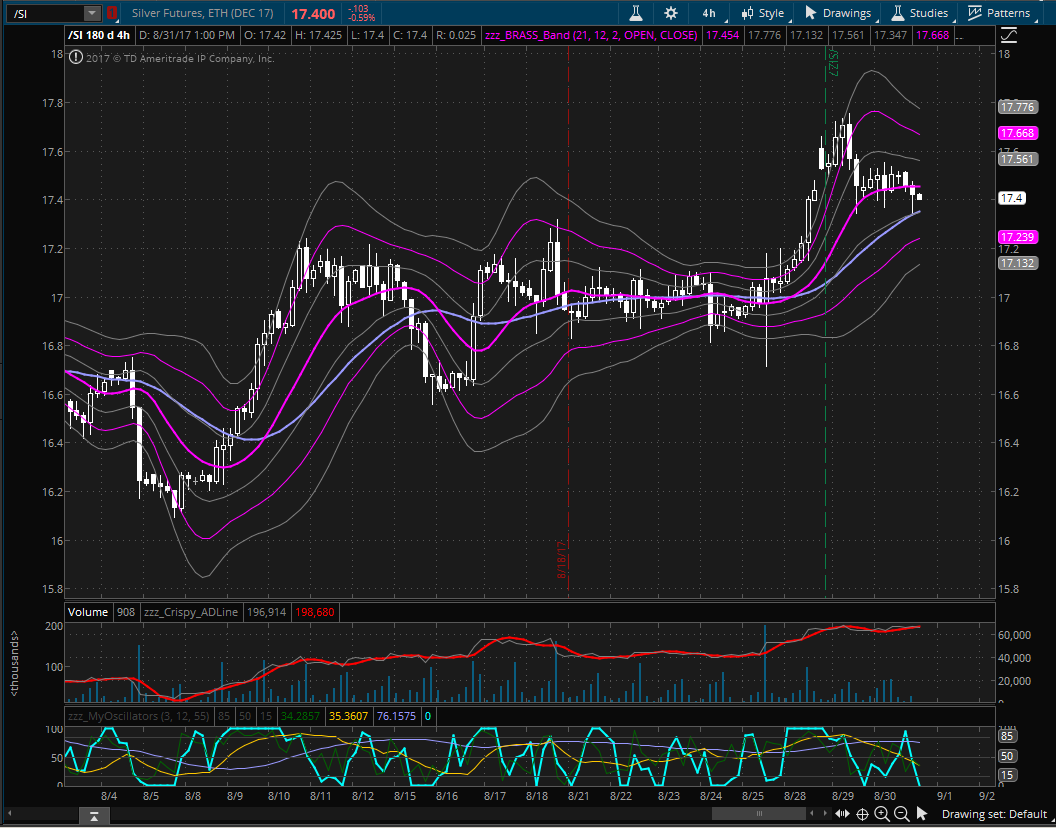
Silver has retraced from a high of 17.755 to 17.34. The story is similar to that for gold. It is also oversold, that means a good buying opportunity.
Up Target 4 : 18.54
Up Target 3 : 18.08
Up Target 2 : 17.93
Up Target 1 : 17.71
Support : 17.32
[ Note: This post represents my opinion only and is not to be construed as financial advice. I do not discuss my trading positions. You alone are responsible for your own trading. Do your own due diligence. ]
If you like my analysis, please join Steemit (if you haven't already), upvote me, resteem, and tell your friends about it.
Thank you very much!
All the best! ;-)
Thanks for sharing. It's always good to read different analyses. This one was especially helpful since I have holdings in all of these except BCH.
I'm hoping for some uptrends in gold and silver especially. It would also be nice to see Ripple finally go somewhere big.
Thank you. If you follow my analyses day by day, you'll find that I advocate patient and non-emotional trading.