Market overview after the Bitcoin hard fork
The overview of top 50 cryptocurrencies, where I compare prices during the market crash on the 16th of July with today’s prices – right after the bitcoin cash (BCH) was issued. Do you still remember the crash during the middle of July? Many of us have missed the opportunity to buy cheap altcoins and are waiting for another entry point for fast gains. In case you plan to invest for true long term, this should not bother you much, but if you think of short term to midterm, it is always good to begin with a discount. The worst thing that happens to me is when I buy a coin and it goes down right away. I don’t think I am alone in this. Therefore, I compare the discounted historical prices from the 16th of July with today’s prices. Bear in mind, that in the moment of writing most of the altcoins are already between 5-10% in increase. In my opinion, this is mostly because people received their bitcoin cash and can move bitcoin back into altcoins – I believe we will see increase in the altcoins for at least few more days as many people are going to do this.
However, back to the point. I have an excel sheet with actual prices of top 50 cryptocurrencies and I like to compare the present price to major market swings to get better overview of the coins potential. In the following picture, I compare the present prices with the last major drop in the market which happened on the 16th of July. I am not going to give you guidance on this, as I am not an adviser, but I believe this should be helpful to you.
Comparison of prices between 16th of July and 1st of August, 2017 – the cheapest:
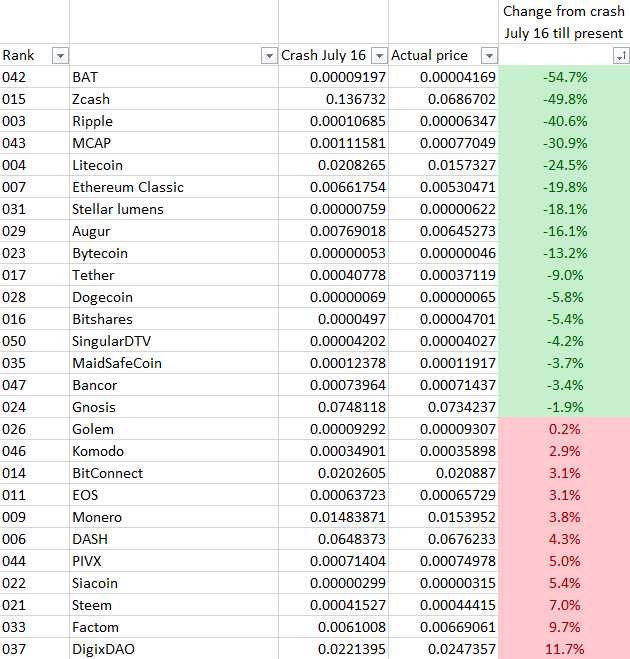
As you can see, the prices highlighted in green are the ones which are now cheaper than they were during the last market crash. In case you were blaming yourself for not buying during the crash, this is your lead where the prices might theoretically bounce in rather short time. Be careful of ICOs – their prices are not really predictable.
Comparison of prices between 16th of July and 1st of August, 2017 – the most expensive:
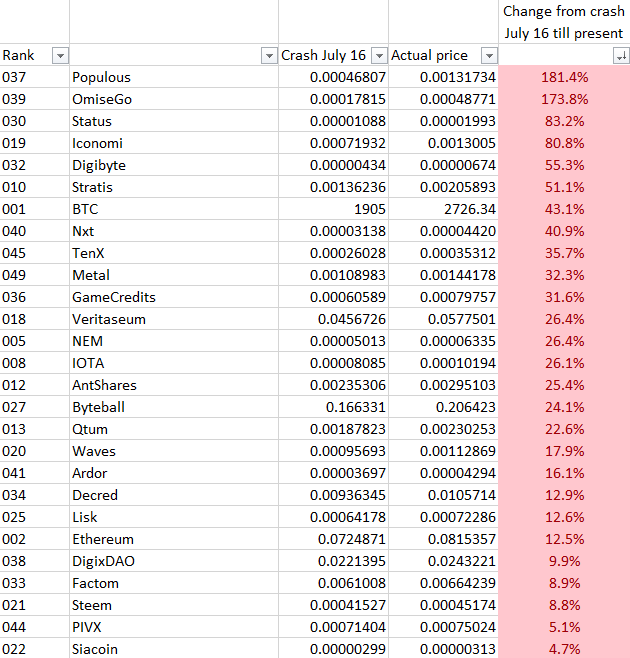
On this picture, you can see the opposite, the coins which already gained the most from the last crash – you can perceive this two ways:
- The coin is strong and the market crash does not affect it. It has its own development in price.
- The coin is already on the rise, it might keep rising, but the potential of high gain is theoretically lower than of the coins which have not recovered yet and are on the discount.
The analysis is solely on you, I would appreciate, if you could give your bit of knowledge into the comment section, because the community makes the best decisions and everyone can benefit from it.
Nice post! I will follow you from now on.
Congratulations @thetop! You have received a personal award!
Click on the badge to view your Board of Honor.
Congratulations @thetop! You received a personal award!
You can view your badges on your Steem Board and compare to others on the Steem Ranking
Vote for @Steemitboard as a witness to get one more award and increased upvotes!