Making Trades: An Order Book Visualization
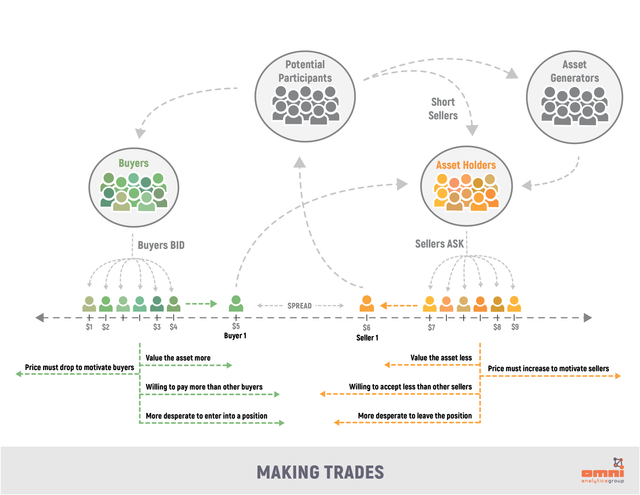
“Making Trades” is a visual representation of an asset’s order book that portrays the different market actors before, during and after a trade is made. Everyone starts off as a potential participant, ready to get involved in the market by either buying, short selling, or generating the asset.

While buying an asset is self-explanatory, short selling is the process of borrowing the asset with the intent to sell it on the open market. Asset generators are those who can literally create the asset. Traditionally this is done by issuing shares, but in the case of crypto, tokens can be released through an ICO or given to miners as a reward for securing the blockchain. Once the participants have classified themselves, the buyers and sellers order themselves according to their price preferences.
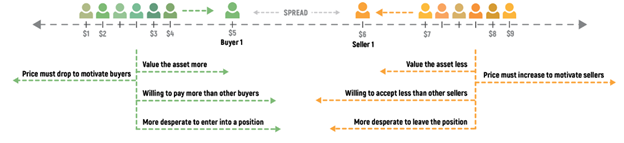
As they line up, the buyer willing to buy at the highest price meets the seller willing to sell at the lowest price. If they meet, then a trade is immediately executed. If not, the difference in price is denoted as the spread. These two may adjust their prices, or usually, circumstances change amongst the other sellers and buyers that motivate them to adjust their prices. This market agitation frequently results in a new arrangement of participants, and subsequently, a new bid, ask and spread. Once a seller and buyer agree on a price, the trade executes converting the buyer into an asset holder, while the seller returns to the potential participant pool ready to make their next move.