Bitcoin (BTCUSD) Big Picture - Bull or Bear?
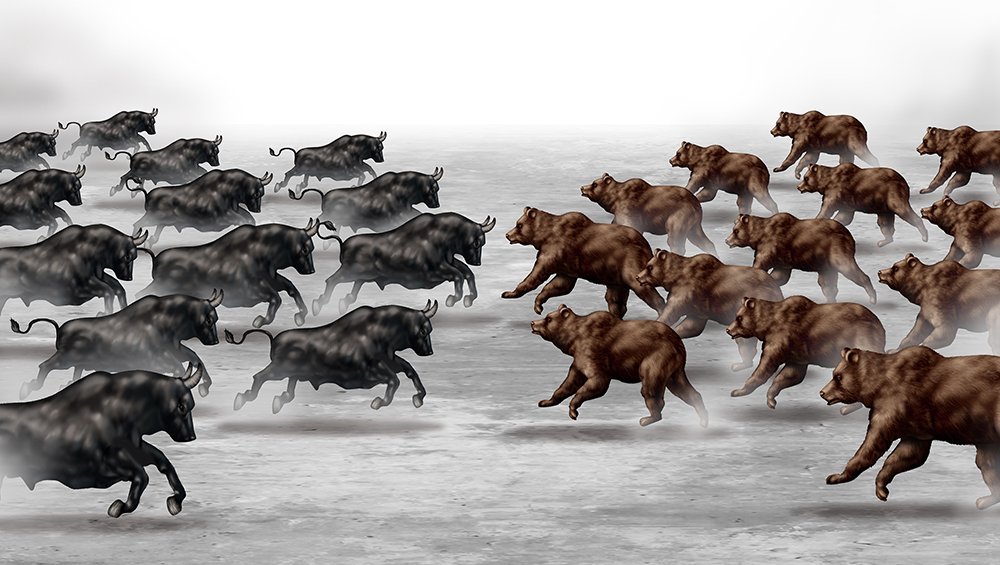

Image Source: agmetalminer.com
G'day Steemoans!
If you read my post from yesterday then today should be best the day of your life. Assuming you're practicing compounding in the betterment of your days then every day should be the best day ever.
Anyway, I want to answer, from a technical perspective, the most debated question in Bitcoin right now: "Are we in a Bear or a Bull market?" Well, the answer is that we are still in a bull market if you are considering the trend.
BTCUSD Weekly - Log Scale
Well, we are sitting on support so, until we have a weekly close below the long-term trend line we are still in a technically bull market. That's not to say that in medium-term we are correcting (much needed) or even that we are headed for a bear market but as of now the trend is your friend and the trend is northward until broken.
Should the trend be broken, the next major area of resistance (what I would look for as the start of support for a true downtrend) would be the 200 day moving average on weekly candles.
"But, but, but this is on logarithmic scale! I thought we were looking at price?" Look at all angles! It's important to get the full 360 degree view.
Same Chart with Regular Price Scale
It's not nearly as clean but paints the same picture - i.e. still have not broken long-term trend.
What does this tell me?
Look for buy opportunities when trading the trend and short lightly. it doesn't mean "buy now!" but more than my bias percentage is more long than short.
BTCUSD Weekly - Back to Log
Look at the similarities in price and volume in the ellipses. It's almost uncanny the resemblance to past reversals over the past year. Three red weeks with the most volume being in the second week. Even the timing is worth noting: from the first highlighted reversal to our current area is within one day (yes, 366 days ago!).
At this point, I'm looking for price to end the week lower and, if the past indicates the future, a reversal candle next week. Nothing would be set in stone until the next candle closes but that it what I am watching.
The last thing that I'll be watching is how RSI looks at the close of this candle. Notice that, as of today RSI is flat with the most recent low while price is slightly higher? Yeah, me too. We'll know more once this weekly candle closes but it is pointing to possible bullish divergence.


Image Source: cdn.dribbble.com
It's no secret that Bulls and Bears are duking it out but at this point the bulls have not lost nor have the bears won. The only thing that can tell us is time.
As usual, leave me a comment with your thoughts. Good, bad or lewd I want to hear ya.
Good luck out there and happy trading folks!
Congratulations @tdiv7653! You have completed some achievement on Steemit and have been rewarded with new badge(s) :
Click on any badge to view your own Board of Honor on SteemitBoard.
To support your work, I also upvoted your post!
For more information about SteemitBoard, click here
If you no longer want to receive notifications, reply to this comment with the word
STOP