Advanced Technical Analysis Using Fractals ]-Steemit Crypto Academy | S5W8 | Homework Post for @reddileep
Hey guys,
Welcome to the last week of the season 5 SteemitCryptoAcademy intermediate lecture by Professor @reddileep
Without wasting much of our time, let me quickly proceed with the given tasks.

QUESTION 1
The cryptocurrency market is very volatile and for that reason, its price movement changes often forming different patterns which make up the price chart.
These patterns tend to repeat themselves with time allowing traders to execute their market psychology with the mind that a similar outcome is expected as before. This psychology is what often leads to the expected outcome.
A lot of chart patterns repeat often and the most common ones are; Hammer-head, Engulfing candle, Morning star, Inverted hammer, Double top, and bottoms, etc.
A lot of traders especially those whose analysis is based on Price Action Techniques make use of these Fractals in making trading decisions.
Fractals can simply be regarded as reoccurrence of patterns on the price chart which are usually a result of trader's psychology.
Just as traders do not rely only on price actions (formation of higher highs and lows) in identifying trend directions, but also employ the use of trend indicators such as Parabolic Sar, Moving Averages,, etc for easy identification of trends. Similarly, a lot of Fractal indicators have been developed in other to help identify repetitions on price charts.
There are a lot of fractal indicators which include; Fractal support and resistance, Fractal Breakout, Fractal Alligator alerts, Fractal Resonance Bar, Fractal Adaptive moving averages and with the most common being Williams Fractal.
Fractals is a trading strategy that allows traders to predict the possible price movement of an asset by making use of repeated pattern formations.
Fractal indicator is an indicator that allows traders to identify repetitions on the price chart by mere application of the indicator.
This Indicator provides a lot of signals and a good knowledge of this indicator will aid a trader to easily observe and interpret market psychology in other to know when and where to enter and exit the market.
The application of this indicator on the price chart indicates when the price is high and when there is a drop in the price of an asset.
Nevertheless, the Fractal indicator is best used with the combination of other technical analysis tools in other to maximize profit and minimize loss.
QUESTION 2
In other to identify Fractals, we should first take note of the two types of Fractals which are the bearish and the bullish Fractals.
There are few simple rules required in other to identify a Fractal. These are regarded as rules because they are ought to be obeyed in other to avoid unnecessary loss during Fractal trading.
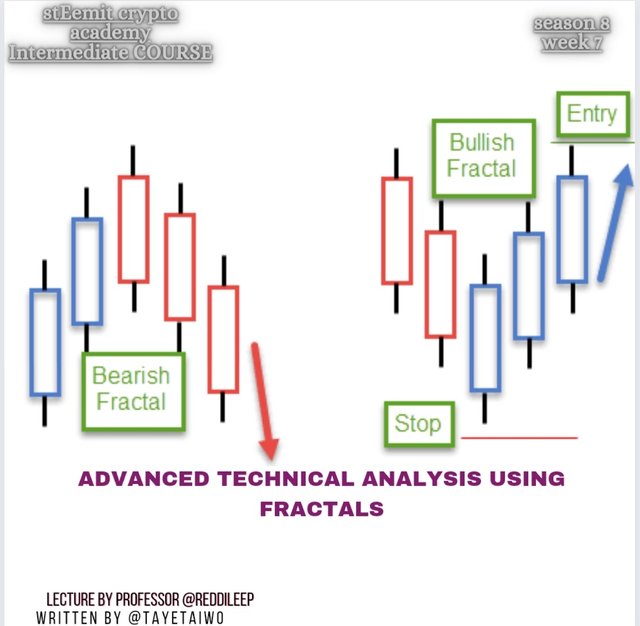
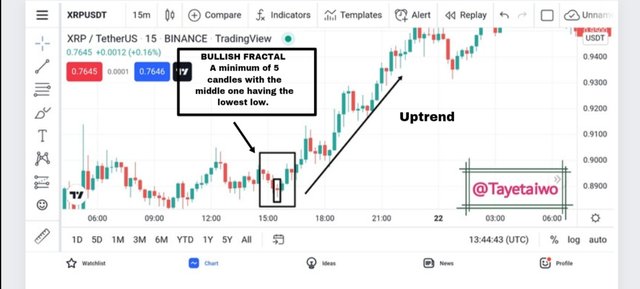
- BULLISH FRACTAL
In other to identify a Bullish Fractal, we will have to, first of all, ensure that there are at least five candles involved otherwise the candle pattern won't be regarded as a Fractal or will be a Fractal will a very low accuracy.
Secondly, the candle in the middle of the Fractal should be seen to have the lowest low while those on both sides will have the higher lows.
- Screenshot
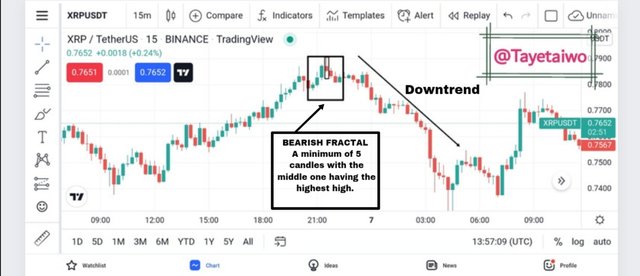
- BEARISH FRACTAL
Similar to bearish Fractal identification, the bearish Fractal is identified by first confirming a minimum of five candles. This is to make sure that the chart formation is a Fractal otherwise it will be discarded or regarded as a Fractal with very low accuracy.
Secondly, in other for a Fractal to be regarded as bearish, the middle candle will be seen to have an apparent higher high compared to the candle on both sides which will be seen to have a high lower than the middle candle.
- Screenshot
QUESTION 3
As we have already known, Fractals is a trading strategy that allows traders to predict the possible price movement of the market by making use of repeated pattern formations of price charts.
These patterns can be identified by a careful observation of the overall price chart but in other to increase the efficiency in observation, a lot of indicators have been developed to aid traders to easily identify Fractals and these indicators include;
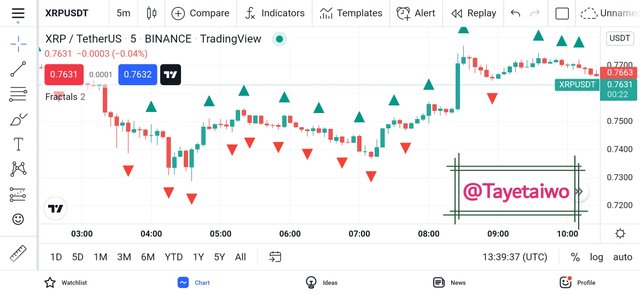
- WILLIAMS FRACTAL
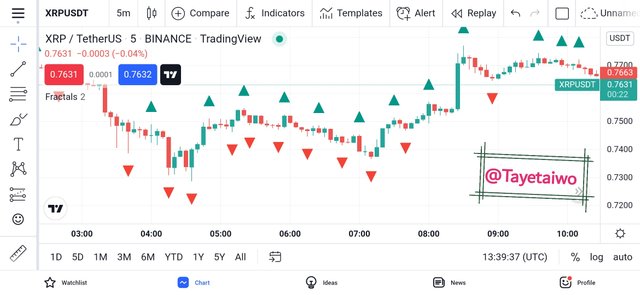
William Fractal is the first Fractal indicator on the list of Fractals on the trading view platform.
Its default settings are made up of multiple red and green arrows pointing to the price chart.
The green arrows which are found above the price chart are referred to as bearish Fractal while the red arrows which are located below the price chart are referred to as bullish Fractals.
These Fractals aids traders in identifying when and where to enter and exit the market.
- Screenshot
- FRACTAL SUPPORT RESISTANCE
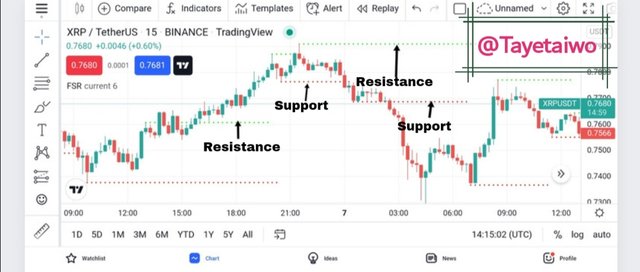
The Fractal Support Resistance is a Fractal indicator that easily identifies the areas at which prices have tasted repeatedly and have found them difficult to break upwards or downwards.
These upwards zones are regarded as resistance for an up-trending price while the downward zones are referred to as support. These areas are formed as a result of traders' psychology which makes them expect similar outcomes whenever price gets to them.
These expectations are what cause repetition of events as traders tend to take the same position that has been previously taken by formal traders.
- Screenshot
- FRACTAL BREAKOUT STRATEGY
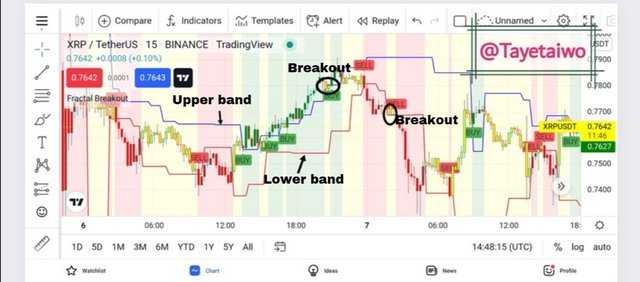
The fractal Breakout indicator is a Fractal indicator that helps to identify price breakouts on the market.
This Indicator comes with default red and blue bands which serve as resistance and support.
When the price breaks the resistance band, it signals a possible bullish trend movement. This signal allows traders to enter the market in other to secure an intending profit.
On the other hand, when the price breaks the lower band which serves as a support, it signals a bearish trend movement. This signals a trader to take a sell position in other to secure profit.
- Screenshot
QUESTION 4
We have already talked about some Fractal indicators, their uses and applications.
Now we will be comparing a market chart with past data by checking to know if a previous chart has been repeated over time.
In performing this task, I will be making use of the Tradingview App on XRP|USDT pair.
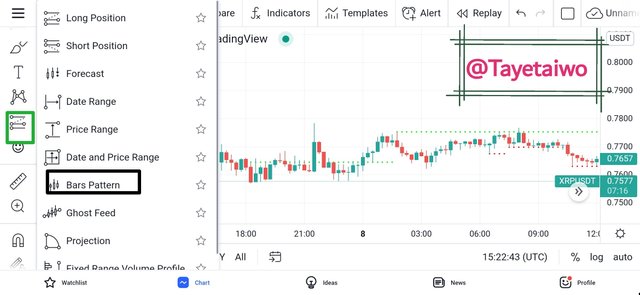
- STEP 1
On the Tradingview App click on the icon circled green. And new interphase will appear then click on Bar pattern in other to be able to copy a chart pattern.
- screenshot
- STEP 2
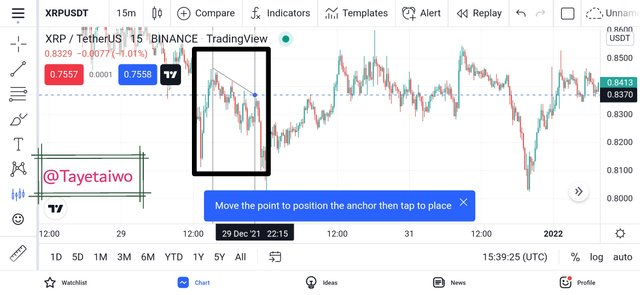
Select the desired chart pattern and draw a trendline on it accordingly.
- screenshot
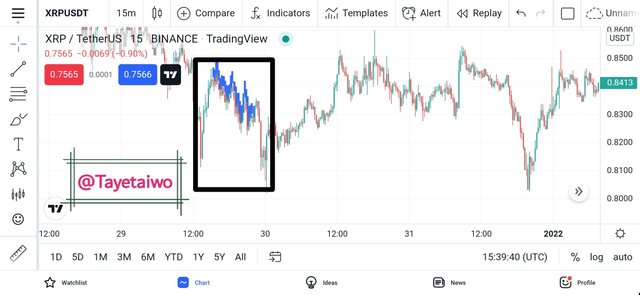
- STEP 3
Paste the chart pattern on the selected chart pattern.
- STEP 4
Move the pasted chart pattern to another suitable chart pattern.
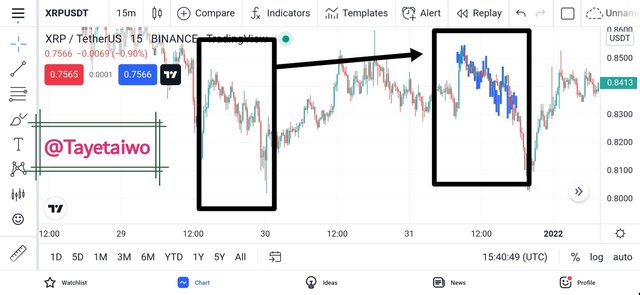
The above will help a trader to predict the possible price movement due to the formation of similar chart patterns indicating similar market psychology.
QUESTION 5
In this task, we will make using some Fractal indicators such as Williams Fractal and Fractal Support Resistance to analyze a 1M chart of XRP|USDT pair.
- BULLISH POSITION
In other to take a Bullish position, we will first observe the current happening on the market as identified by the Fractal indicators.
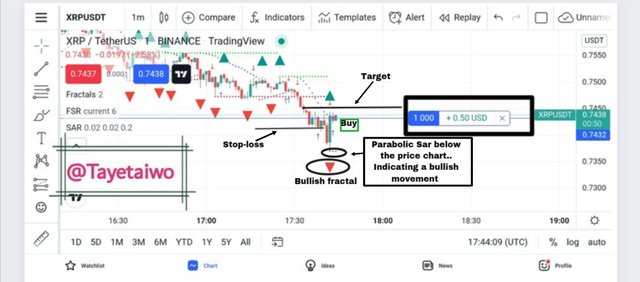
From the above analysis, we will observer that the applied Parabolic Sar which serve to identify market trend, was found to be below the price chart indicating a bullish movement.
In addition to that, the red bullish fractal was also found to be under the current price chart which also indicates a bullish movement.
- ENTRY AND EXIT
After a careful observation of the above two indicators, I took a buy position with my Stop-loss set just under the current resistance of the price chart and my Target set in consideration of the Stop-loss in a ratio of 1:1.
- ANALYSIS RESULT
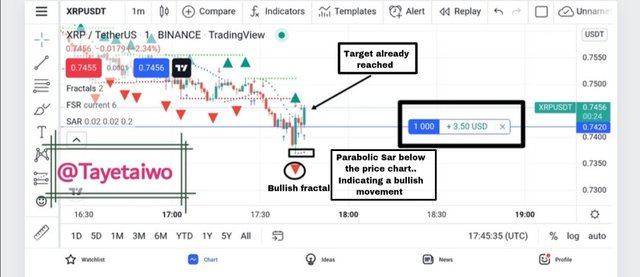
After the careful analysis, I checked back to see that the marked target has already been reached with a profit of $3 made which serves an an evidence of a successful trade.
CONCLUSION
Fractal is an important trading strategy that aids in identifying repetitions on the market chart. It aids traders in making good trading decisions by helping them to identify reoccurrences on the market chart. This allows traders to take either a buy or sell position with the hope that the previous result will be repeated.
A lot of indicators have been developed for easy identification of Fractals yet these indicators are best to be combined with other technical analysis tools to ensure a more accurate prediction.