Crypto Academy Season 4 [ Advanced course ] week 6: Crypto Trading With Chaikin Money Flow Indicator / My homework task


This week Professor @kouba01 brings us another interesting topic for those of us who like to venture into the sea of opportunities in the cryptocurrency market: "Crypto Trading With Chaikin Money Flow Indicator", understanding the operation of this indicator expands our arsenal of tools for market analysis so we can benefit from it. I thank all those who make this initiative possible.
For those who wish to see the content of this class, you can find it HERE.

Homework task
1- In your own words, give a simplified explanation of the CMF indicator with an example of how to calculate its value?
The Chaikin Money Flow (CMF) indicator, created by Marc Chaikin, is used to measure the cash flow volume, during a set period of time, understanding as "cash flow volume" the amount of money traded in the market (buying and selling of assets) during that period of time.
This indicator, considered as oscillating, is useful to have an idea about the interest of investors in the assets in the market at that time, since when there is a strong volume of cash flow, it means that investors are interested in the asset and when there is little volume, investors are less interested. In other words, the Chaikin Money Flow (CMF) indicator helps us determine the strength, direction and momentum of the market.
Chaikin Money Flow sums the Money Flow Volume for a given period (the most commonly used periods are 20 or 21 sessions), which results in an indicator that fluctuates around zero as a central value. Basically the CMF is taken as a measurement value of the balance between buyers and sellers, while the crossing of the CMF and its zero level are used to identify changes in the money flow.
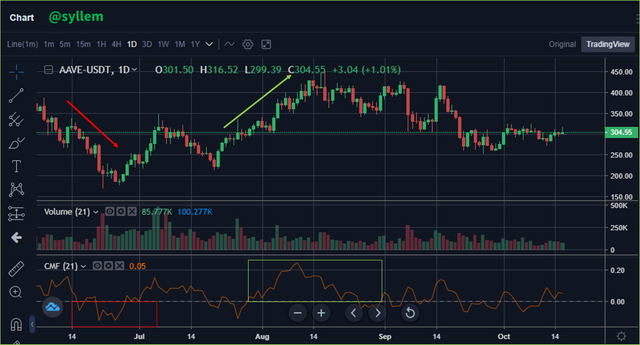
The following image shows a chart prepared from the Okex exchange of the AAVE/USD pair in 1-day candles, where I chose the Tradingview chart available in OKEX and from there I just had to look for the indicator and activate it, the CMF comes by default for 20 days, but I changed it to 21. If we place the cursor over any candle, in the upper left part of the box where the indicator is framed, its value is shown. In this case for October 15 it has a value of 0.06, and in the following part I will make its calculation, following the equations given by the professor @kouba0.
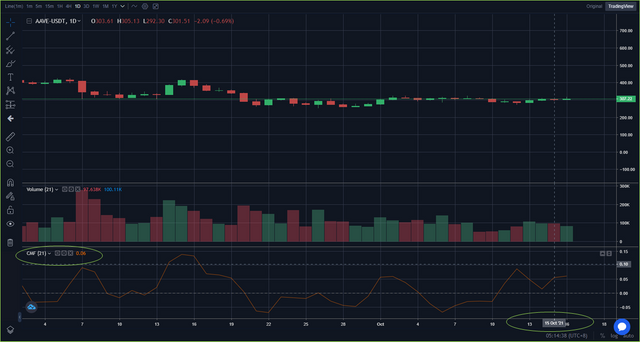
AAVE/USDT (1D) - Ind: CMF Fuente
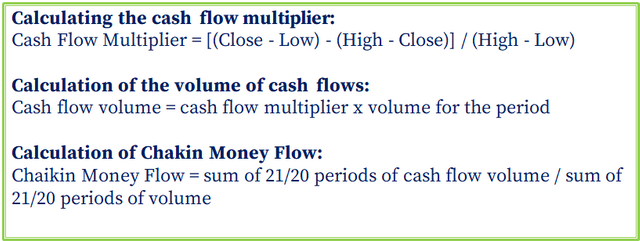
Alternative method to calculate the Chaikin Money Flow technical indicator Fuente
Using a 21-period temporality, I downloaded from Coinmarketcap the historical prices of the AAVE/USD currency, for the last 21 days and sorted the information in EXCEL, where I also added the equations given by the professor, shown above, and in this way I was able to obtain the CMF.
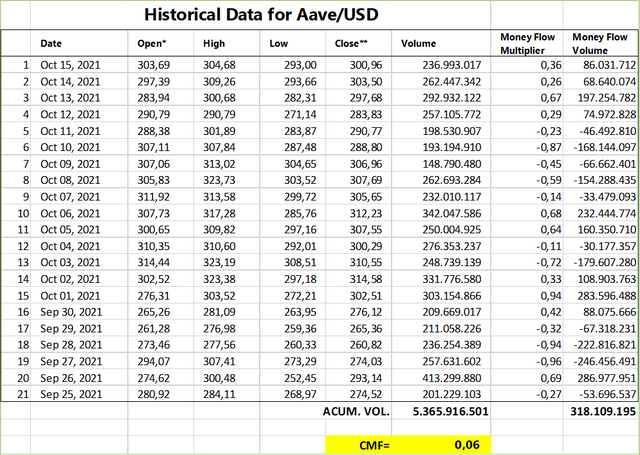
Chaikin Money Flow Technical Indicator (CMF)
In Excel it is simple, each cell has its own formula, I will only show the image of the indicator calculation cell, so as not to make it so long:
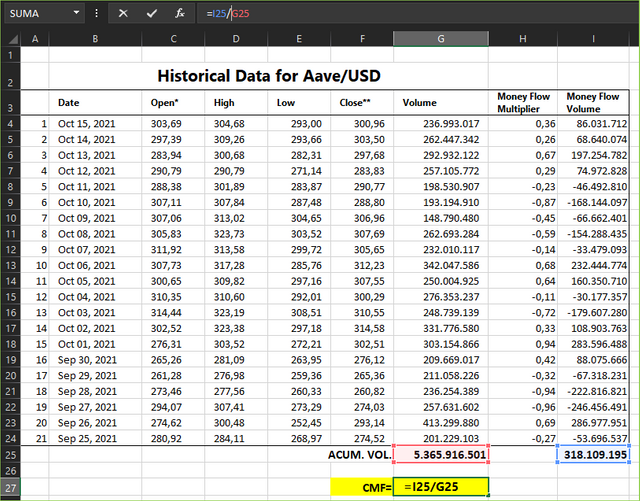
Chaikin Money Flow technical indicator (CMF)
I was very happy when I saw that the CMF value matched that of the Tradingview chart on Okex, shown above.
Regarding the interpretation of the value obtained (0.06), being positive it is an indication that the buying pressure exceeds the selling pressure, which is consistent with the price action at this time.
2 - Demonstrate how to add the indicator to the chart on a platform other than the tradingview, highlighting how to modify the settings of the period(best setting).(screenshot required)
As I mentioned before I worked with the Okex exchange, it does not have by default the CMF indicator option, but as almost all platforms of this type it has the option to use the Tradingview tool, so it is not limiting, I only had to change the chart option from "Original" to "Tradingview", in the upper right side which is highlighted in the following image:
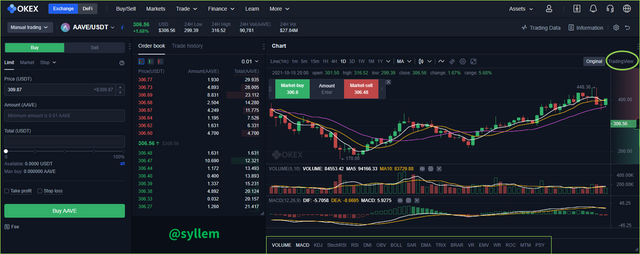
AAVE/USDT 16/10/2021 Fuente
Then look for the option indicators, which is shown inside an oval in the following figure and displays a list of indicators, just by typing the C, the CMF indicator appears as the first option, then just select it and add it in a lower panel in the graph.
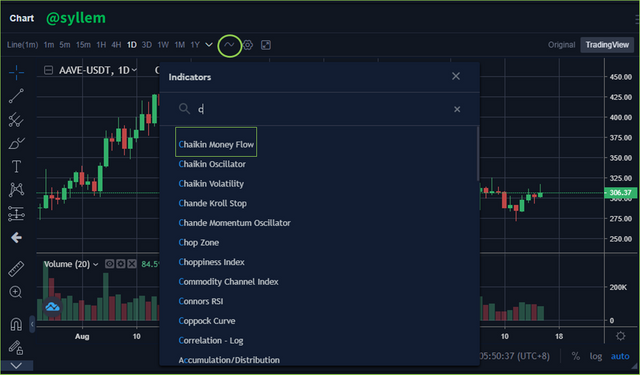
AAVE/USDT 16/10/2021 Fuente
In the CMF indicator panel, there is the wheel that indicates the configuration option, by default it is 20, but from there I have changed it to 21 periods, in "Input" / "Lenght", just by typing that number. As the professor explained, these are the two most used periods.
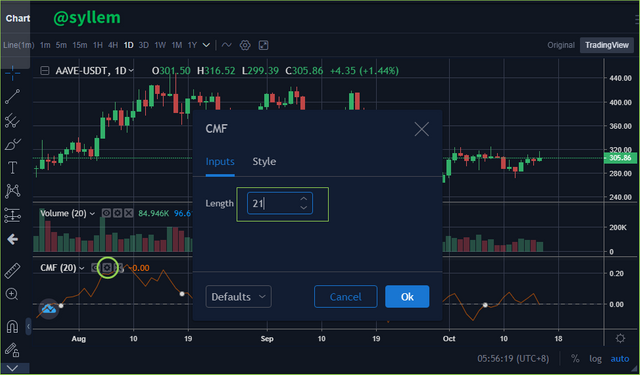
AAVE/USDT 16/10/2021 Fuente
In the following image you can see the graph with the modification made.
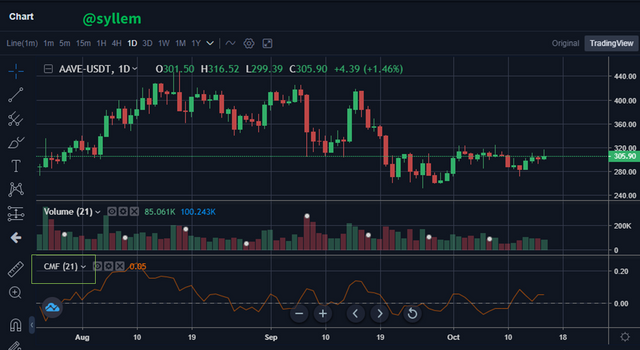
AAVE/USDT 16/10/2021 Fuente
3 - What is the indicator’s role in confirming the direction of trend and determining entry and exit points (buy/sell)؟(screenshot required)
As mentioned before and in simple terms, CMF is a technical indicator of the oscillator type that is taken as a measurement value of the balance between buyers and sellers, if it is positive, it means more buying pressure than selling, so the price tends to rise; if it is negative, it means more selling pressure than buying which indicates it must be accompanied by a decline in prices and if it is neutral it must mean a range or period of indecision. The cross of the CMF and its zero level are used to identify changes in money flow.
AAVE/USDT 16/10/2021 Fuente
Therefore, if the indicator after having negative values crosses the zero line, it can be interpreted as an increase in buying pressure, so it can be an entry point and if, on the contrary, after having positive values, it crosses the zero line going to negative values, it would be a selling point.
In the following chart of AAVE/USDT in a four-hour time frame, I am identifying marked with a yellow line, a possible entry and exit point, given by the crossing of the CMF with the zero level, of course for trading we must rely on other indicators such as RSI, volume, MACD, among others, to have more information to support our entries and exits.
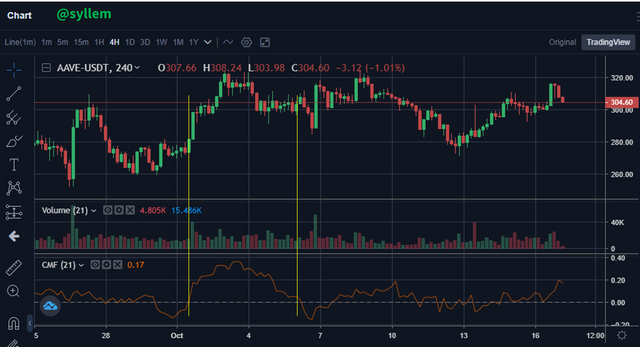
AAVE/USDT 16/10/2021 Fuente
4 - Trade with a crossover signal between the CMF and wider lines such as +/- 0.1 or +/- 0.15 or it can also be +/- 0.2, identify the most important signals that can be extracted using several examples. (screenshot required)
Continuing with the previous idea, sometimes the volatility of the market makes that when the CMF indicator is used, it gives us a weak entry, because it can cross the zero line from top to bottom, and then fall again, leaving us losses if we trade in the short term, so it is better to wait long enough for the indicator to exceed levels of 0.1 or less than -0.1, to have a better opportunity to buy. That is why it is necessary to analyze the ranges +/- 0.1 or +/- 0.15 and even +/- 0.2.
For the following analysis I will use a +/- 0.15 control line (red and green horizontal line added to the chart) to locate the best entry and exit options using the same chart.
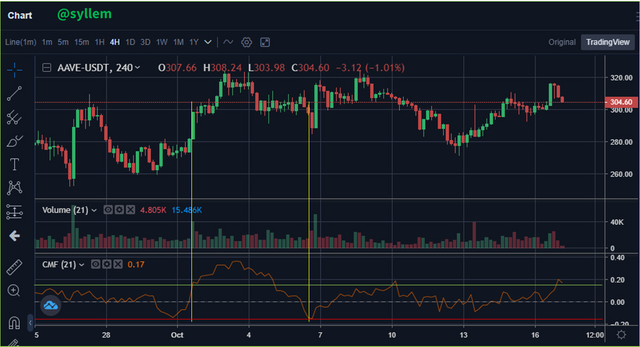
AAVE/USDT 16/10/2021 Fuente
With the yellow lines the possible buy and sell points are marked. When we expect the indicator to rise from -0.15 to 0.15, it indicates that the upward momentum is strong, thus ensuring that we do not quickly go below the zero line. If on the other hand we let the indicator fall from 0.15 to -0.15, the strength of the move is notably bearish and the price is likely to continue falling. However, as I said before, it is better to accompany this indicator with others, to have a broader view of the picture, usually the oscillator indicators give a late signal, although many times it is still useful.
5 - How to trade with divergence between the CMF and the price line? Does this trading strategy produce false signals?(screenshot required)
Identifying divergences is usually very useful when trading the market, because when there is a divergence between the price and an indicator, for example volume, it indicates that the price action is going in the opposite direction of the volume, and the market will seek to balance itself by making the price go in the direction of the volume. In this case, if there is little volume and the price is rising, the price will most likely fall back.
In the following chart, where the yellow arrows are shown, we can observe a bearish divergence considering the price action and the CMF indicator, as prices continue to rise while the indicator changed its direction and goes down.
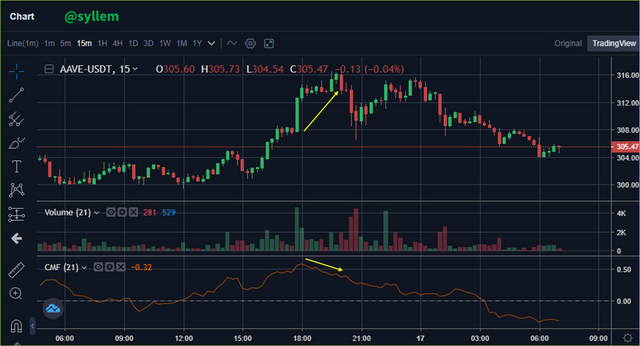
AAVE/USDT 16/10/2021 Fuente
In the following image you can see that prices are falling, but the CMF indicator remains in range, which would be indicative of a bullish divergence and implies a rebound in price, as indeed is being observed.
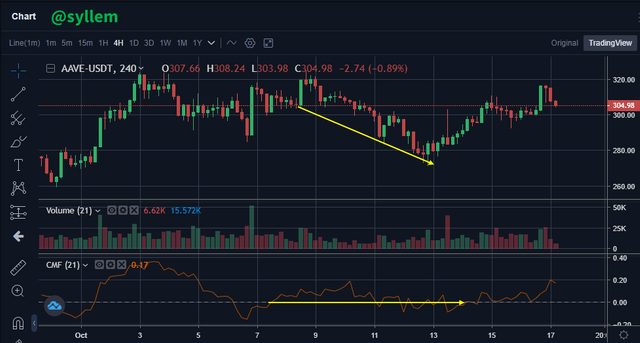
AAVE/USDT 16/10/2021 Fuente
6 - Conclusion:
The CMF is a technical indicator of the oscillator type, which moves between zero and one, with which we can be guided to identify the best buying and selling points when trading the market, as it measures the selling pressure (when the indicator is below zero) and the buying pressure (when the indicator is below zero).
As is the case with the other indicators that exist, it is necessary to design a strategy combined with other indicators for greater reliability, since no indicator alone is reliable enough, each one can provide different information and help us together to make decisions that minimize our losses and maximize our profits.

See you soon
Thank God for every moment of life
and to you for joining me in this reading.
The photograph shown is my own, edited in Power Point.
Emojis made with the Bitmoji application.
The separator used was made in PowerPoint.
Translation courtesy of DeepL.com
Hello @syllem,
Thank you for participating in the 6th Week Crypto Course in its 4th season and for your efforts to complete the suggested tasks, you deserve a Total|6.25/10 rating, according to the following scale:
My review :
Work with acceptable content. It was possible to go deeper into the ideas presented and provide several examples. Here are some notes that I bring to you.
Good explanation of the CMF indicator with all its features and method of calculating it.
You didn't delve into how to choose the right settings for the periods.
You haven't clearly shown how the divergence strategy is capable of bypassing or not the false signals.
Thanks again for your effort, and we look forward to reading your next work.
Sincerely,@kouba01
Thank you for your comments, I hope to do better next time.
Have a great day.