Crypto Academy Season 4 [ Advanced course ] week 2: Crypto Trading With Volume Indicator | BY @svm038
Hi steemians,
Today I will do my second assignment on Steemit. I studied the homework given by Professor @kouba01 and I will present my homework to you as I understand it.This is a topic that everyone who analyzes should learn and know.In this way, we will understand the volume in trade.
As someone reading this for the first time, I hope you like my homework.
.png)
Technical analysis is one of the topics that should be known by those who invest in the stock market or any trade.
The more you know about buying and selling in the trade, the more money you make. It is very important to be able to perform technical analysis in order to interpret and predict this trend correctly. The most important point in this regard is the volume indicator in trade.

what is Trade Volume Indicator?
Volume in Trade refers to the number of financial instruments traded for a period of time we specify.is an invaluable tool in analysis. It is an invaluable tool in analysis. sometimes overlooked by investors. however, few analysts know how to use this information to make accurate predictions and minimize risk.
The data we want is transferred from market exchanges.
In these exchanges, a green candle is used to show the up volume and a red candle is used to show the down volume. It allows us to predict the sudden buy-sell price change in the transaction.
Strong trend signs are addressed as trading volume increases. There are many details to using volume in a trade.
Many issues are important in technical analysis. but in order to get detailed information in trading, it is necessary to learn how the volume is. Transaction volume is among the most valuable indicators in the markets.
Question 2 ; Use a platform other than Tradingview to present the volume indicator on a chart and show how to configure its parameters by justifying your choices. (Screenshot required)
First of all, I chose Investing.com - Financial Markets Worldwide for this question.First of all, I chose Investing.com - Financial Markets Worldwide for this question. You can continue without logging in to this site. but I had the opportunity to show it by logging in.
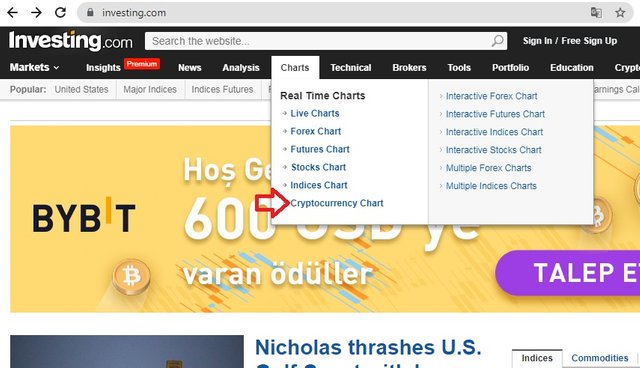
• After logging in, click on the charts tab.Click on the cryptocurrency tab after clicking it.
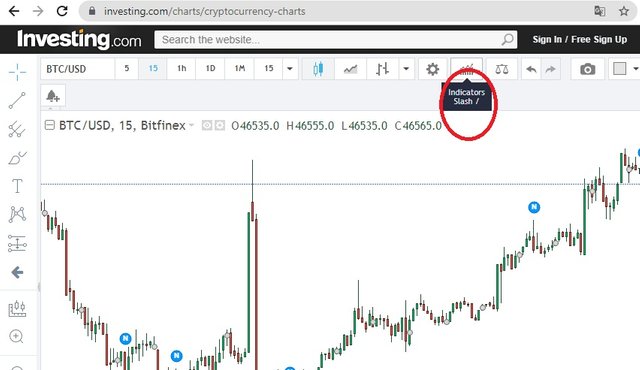
• we will choose which analysis we want to do. Here We Select Indicator Slash
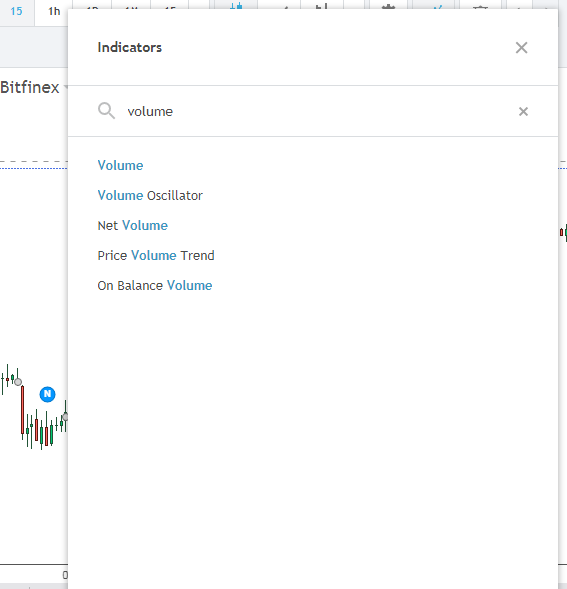
and from here we choose the volume, which is our homework topic.I showed an example using the btc/USD parity.
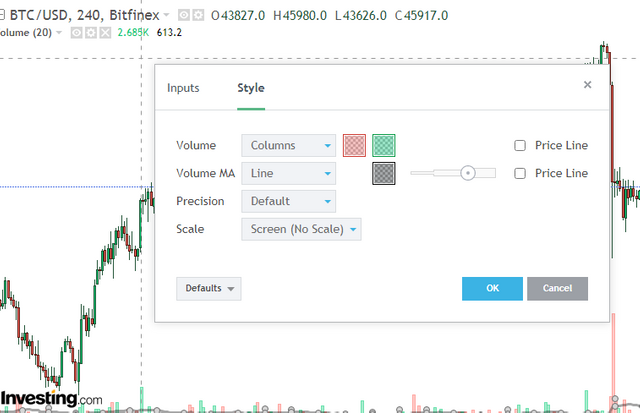
From this tab, there are settings that we have set for myself. You can adjust the colors of the volume indicator.
We will examine the movement, or volume, of BTC/Usd in the 4-hour timeframe.
Question 3 ; What is the link between Volume and Trend and How to use volume to predict a trend reversal? (Screenshot required)
By using volume and trend information, we can direct the rates in the trade.
It is important that the volume of the transaction should greatly support the trend. No trend trading volume is necessarily trend dependent.
It is normal for the trade to increase in volume and to see lows and record volumes. It is an important point in terms of creating safe 'buy' places. This also applies to declines.
By using volume and trend information, we can direct the rates in the trade.
Volume Indicators is one of the main indicators in the Market. The volume of completed transactions measures the strength and severity of active participation in the market.
that is, when the price rises, there is a continuous rise. Again, the same rate of decrease occurs.
It happens with a downtrend. When the price drops, the volume of sales increases.
The simple things to know about the volume are as follows;
• If the volume is increasing in the market, it means that the price is increasing. It means that a large amount of purchases have been made in the stock market.
• If the price is decreasing and the volume is also decreasing, it means that individuals or institutions are not related to the sale.
•The price is increasing but the volume is decreasing; indicates that there is little purchase and no sales despite this
• If the price is increasing but the volume is not, it means that it will return from this point.
• the volume is increasing and the price is decreasing , This indicates that the institution or individual is making too much sales.
a downtrend is observed.
Uptrend means ;
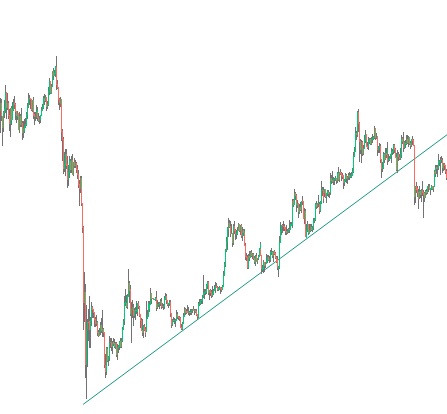
the point at which prices in the trade or the stock market begin to rise. Trend lines are formed by the combination of the two lowest points. For this reason, it will be better if you pay attention to the extreme bottom points while analyzing.
The example below is a simple example.
Screenshot from investing.com site
Screenshot from investing.com site
• In this example, after a sharp volume drop, the price went up, forming the high trend pattern.
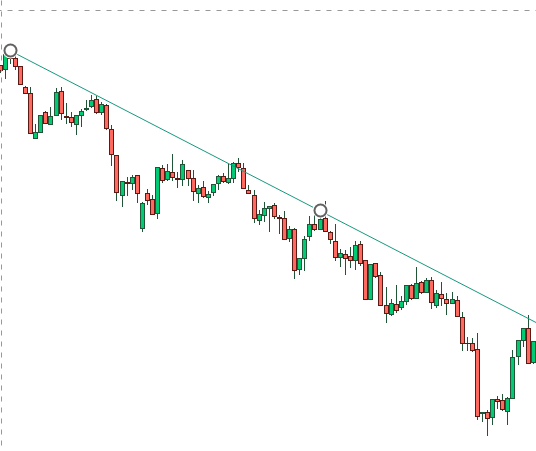
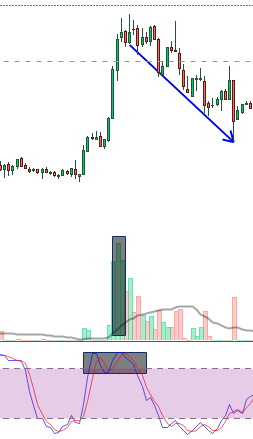
Descending trend: It is expressed as the period showing that the prices in the commodity exchanges begin to decrease. It occurs by combining at least two peaks. Excess peak line confluence exemplifies the analysis best. I have clearly illustrated below.
Screenshot from investing.com site
Screenshot from investing.com site
Key points for a best trend drawing
- It will be better to make logarithmic graphs with logarithmic drawings.
- The more peaks in the merger, the better the result will be.
- This is an analysis that takes a little more time than usual. So you have to do it patiently.
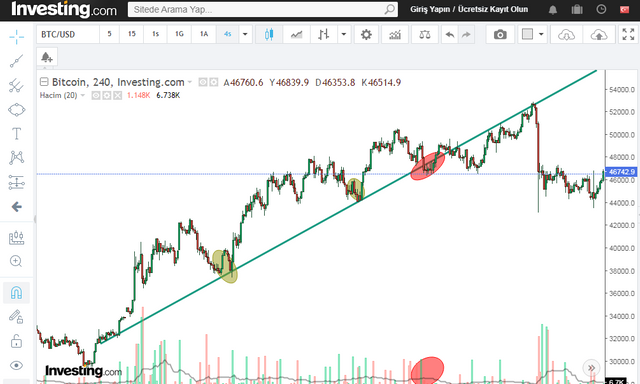
Now, if we give the example of BTC/Usd on the investing.com stock market;
Screenshot from investing.com site
Screenshot from investing.com site
As in the picture, due to the drop and rise in volumes, it provided an exit and fall from the support points.
At the support points I have drawn, since the volume has increased, it has found support and the trend has moved upwards.
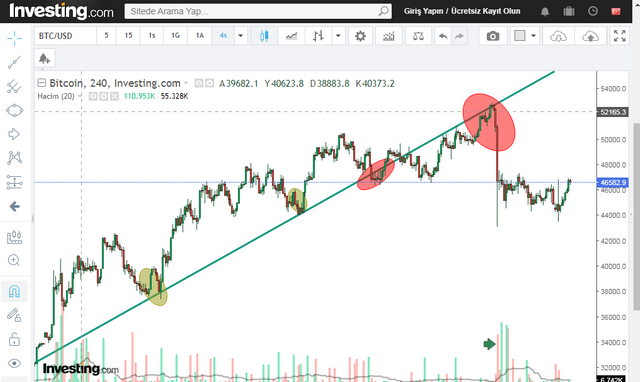
Screenshot from investing.com site
Screenshot from investing.com site
In this picture, the trend was broken in the region marked with red, but since there was a break in volume, it tried to overtake the trend again. but when it didn't, there was a hard selling pressure. Since the last candle's upper level could not break the resistance and could not find enough volume, it became a descending trend.
For forecasting, we can predict prices in the market by finding these uptrend and downtrend lines. In this way, we create trend lines according to the ratio in volume.
Question 3 ; How to use the volume to have a signal confirmation? (Screenshot required)
I know it's important to look at support and resistance points to get this signal in trading. I explained above. Creating trend lines according to low and high volume is the most important point of catching the signal.
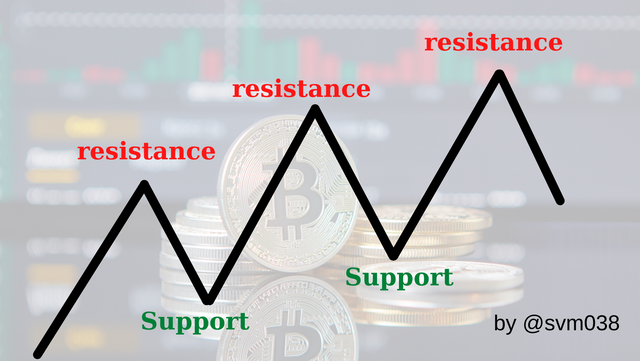
As you can see, I drew this zigzag chart. shows an uptrend (bull market). when prices rise, the lowest level they reach before they start rising again is called the "support" point.
When there are changes in the market over time, resistance and support points are formed and can change. The same is true for a downtrend.
4. How to use the volume to have a signal confirmation? (Screenshot required)
We can get signal confirmation by looking at the support and resistance points.
Screenshot from investing.com site
Screenshot from investing.com site
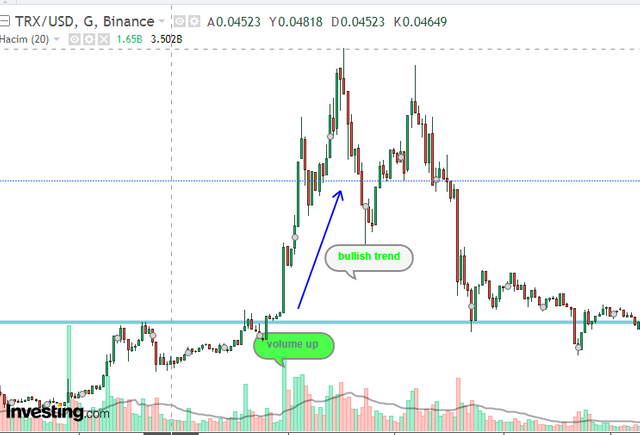
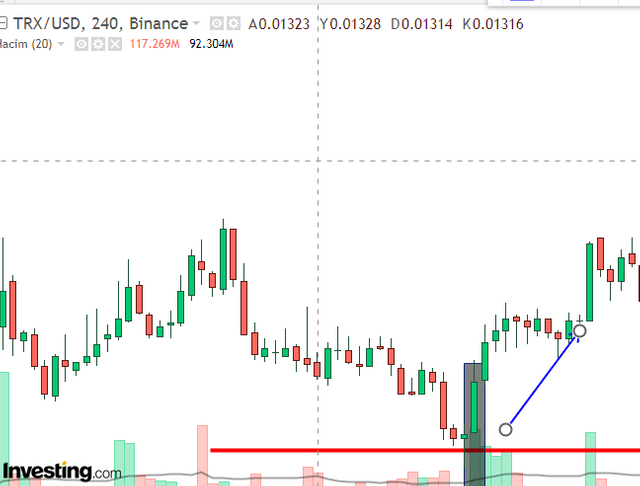
In this screenshot, I examined the trx/usd volume graph. I determined the resistance point with the horizontal line. Due to the abundance of volume at the volume up point, it broke the support and created an upward trend. The volume's reaching 60's has set a good example for the rise.
Screenshot from investing.com site
Screenshot from investing.com site
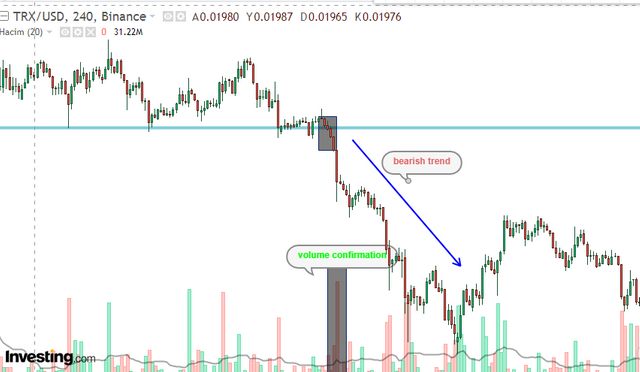
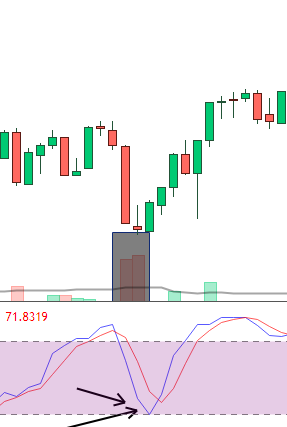
You can see that the downtrend continues with the break of the support due to the high selling rate in the volume. These supports vary depending on the volumes.The decline still continues until the arrow level is seen. In this case, we can call it a bear trend.
When the price rises from the resistance level, that resistance point could potentially also be the support level.
The more the price tests the resistance or support level without breaking it, the stronger the resistance or support point.
When a support or resistance is broken, the mobility depends on how strong that broken support or resistance is.
5. How does the volume reflect the evolution of prices in the charts and why does the volume sometimes anticipate the price? (Screenshot required)
The rise or rise of volume will of course predict the price. A trend line is created by looking at the multiplicity of resistance and support points. Accordingly, it is possible to estimate the price.
The higher the trading volume in a trade, the more the stock has changed hands.
The increase in the transaction volume can be positive or negative due to the increase in sales. The trading volume is calculated by multiplying the transaction amount of the currency subject to the transaction with the buying and selling prices. When the volume increases on the chart, analysts think that they can invest with more confidence and trade on these values.
Screenshot from investing.com site
Screenshot from investing.com site
I have shown the largest volume on the chart. I showed you how to get support and go into an uptrend. In other words, the price increased due to the high volume. This made the prediction correct.
6. Is it better to use the volume indicator alone or use it in parallel with another indicator when trading? Justify your answer
In technical analysis, a single indicator is never traded. therefore it is not correct to trade with volume alone. It is essential to support technical analysis with other indicators and oscillators. Making use of stochastic RSI while trading with volume will make our transactions more reliable. This oscillator is an oscillator that calculates overbought and oversold zones.
This means that the extra indicators used together with the volume support your forecast and allow you to make a profit.
Relative Strength Index (RSI)
RSI is the momentum oscillator. It measures the ratio of up and down price averages. calculates the strength of the trend in the range of 0 to 100.
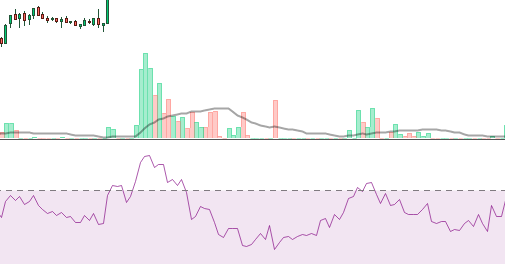
Screenshot from investing.com site
Screenshot from investing.com site
Stochastic Momentum Indicator
The stochastic indicator is part of oscillator indicators such as the RSI and the Commodity Channel Index (CCI). It shows the value between 0-100 according to the volume. Volume density sales are close to 0, volume density purchases are close to 100 with green candles.
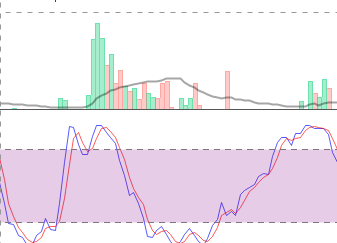
Screenshot from investing.com site
Screenshot from investing.com site
Depending on market volatility, bands widen or narrow. Bollinger bands use three lines to show variation. It is the SMA with a value of 20 (simple moving), a lower band (lower than the value of the SMA), and an upper band (higher than the value of the SMA).
If the market is changing a lot, bands will widen and shrink with falling volatility.
You need to fix the entry and exit points near the upper and lower bands. Sales places are taken at the upper band and a position is taken from the lower band limit.
Bollinger Bands
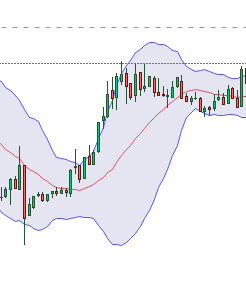
Screenshot from investing.com site
Screenshot from investing.com site
Depending on market volatility, bands widen or narrow. Bollinger bands use three lines to show variation. It is the SMA with a value of 20 (simple moving), a lower band (lower than the value of the SMA), and an upper band (higher than the value of the SMA).
If the market is changing a lot, bands will widen and shrink with falling volatility.
You need to fix the entry and exit points near the upper and lower bands. Sales places are taken at the upper band and a position is taken from the lower band limit.
7. The volume indicators are multiple, choose one of them to briefly explain its usefulness in crypto trading.
Screenshot from investing.com site
Screenshot from investing.com site
According to the graphic I prepared in the example;
There is a high volume ratio in the region I marked. just looking at this, we think that the rise will continue. however, there is a correction as it is in the overbought region according to the stochastic RSI. With this indicator, it is possible to evaluate the volume ratio in parallel. Rsi value reaches 98. This means because of the density of the volume.
When the indicator line shows values above 80, there is overbought. And when values are below 20, the opposite is oversold.
Stochastics can sometimes produce reversals, so analysts should use it in conjunction with other charts.
When these levels are seen, analysts can also show support and resistance levels by drawing horizontal lines.
Screenshot from investing.com site
Screenshot from investing.com site
As I have shown in this example and mentioned before, the value has reached around 20. This indicates a hard sale. In other words, it confirms this prediction by supporting the volume.
8. Conclusion:
Volume refers to a financial amount traded in a given period of time. The number of shares may correspond to the number of contracts or lots. Too much or too little purchase in the market indicates the volume. Depending on the presence of these volumes, support and resistance points are formed.
There are uptrends and downtrends depending on these resistances. It is possible to predict the price from these volume and trend points. Sometimes the forecast can give the right signal.
But for the accuracy of the forecast, it is necessary not to focus only on the volume. However, we have to use other dashboards. This should support our predictions. In the analysis, we realize that too many dashboards can be confusing, and it will not be beneficial to use less dashboards. So when doing hourly or daily analysis, 1 or 2 dashboards will confirm our forecasts along with volume.
Finally, although I am reading these topics for the first time, I have gained a lot of knowledge. I have been researching this homework for 3 days. Thanks to these assignments, I will be able to analyze cryptocurrencies. I finished my homework and I thank the professor.
All screenshots in this assignment are taken from graphics on investing.com that I edited.All assignments are written in my own words.
Steemit Turkey Representative
Founder of Steem women's club
Respects @kouba01
Please havae a look at my achievement4 post
https://steemit.com/hive-172186/@amirbhat/achievement4-or-amirbhat-or-task-applying-markdown
Hi @svm038
Thanks for participating in the Steemit Crypto Academy
Feedback
This is fairly done. since this is a crypto academy. You are meant to talk about crypto as an example and not Stocks . You kept on giving an example of stocks which looked like as if you were teaching someone how to trade stocks using the volume indicator.
What did you mean by this statement?
You need to improve on the clarity of your explanations.
Total| 6/10
@yohan2on
First of all, thank you for approving my assignment.
I was quite surprised to see the value 6 in this research task. Is it possible to talk about crypto without talking about stocks? I think I gave good information about crypto. Especially when I examine the assignments with high scores, I see that it is no different from mine. Regarding the question asked by the professor; How does volume reflect the evolution of prices on charts and why does volume sometimes predict price? (Screenshot required) ;
Sorry if there is a problem with the translation. but this sentence is true and this is what I want to say. I request you to please review.
@kouba01