Repost || STEEMIT CRYPTO ACADEMY S5-W5:: HOMEWORK POST FOR PROF.@sachin08:: ON TRADING WEDGE PATTERNS:: BY @suleja.
HAPPY NEW WEEK EVERYONE
INTRODUCTION
.png)
[edited in canvas]
Wedge Pattern is a type of trading pattern that make use of two trendlines converging at the end of their movement. This means that the lines in question meets at the end of their movement which implies that the current trend will end and a new trend will have to begin. The trendline is usually drawn on the price chart one above the price and the other below the price. This lines found above and below the price acts as resistances level and support level respectively.

MEANING OF WEDGE PATTERN
It is important to mention here that the two trend lines in questions have a large opening at their beginning and as the proceed the contract i.e the come closer to each other. It continues that way until it finally meet each other. This is mostly immediately after the price breakout and then reverses to the opposite direction. When this break out or reversal is about to take place, the volume of the asset will decrease.
We basically see this wedges in a trend market not in a range market. So we can spot wedges in bullish trend or bearish trend movement and because of that, we have two types of wedges I.e the rising and the falling wedges.
Explain both types of Wedges and How to identify them in detail. (Screenshots required)
The both types of wedges we have are the Rising wedge and the Falling wedge. Let's look at them in details one after the other.
Rising Wedge
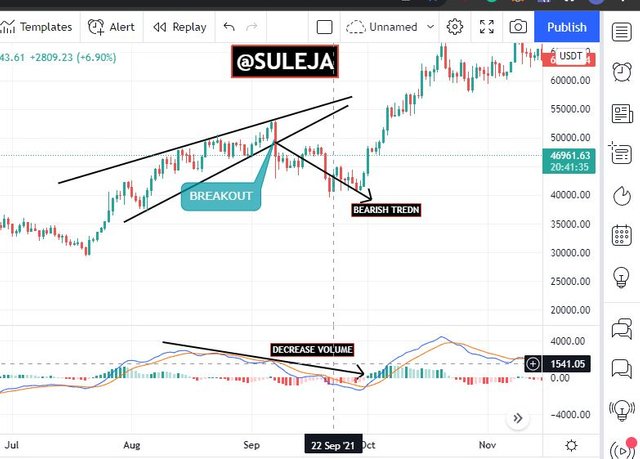
When we talk about the rising wedge, we also refer it to the bearish form of wedge pattern. It is so called because the end result of this type of wedge is a bearish movement in the price of an asset. The rising wedge is a movement of price in an upward direction or uptrend or bullish direction which after encountering a breakout, the said movement will reverse to an opposite direction I.e movement will change to downward direction or downtrend or bearish direction.
The rising wedge uses the two trendline as we have discuss above, one acting as a support and the other acting as a resistance. The lines continue to move until they meet (Converge) each other at the end. When this is about to happen, the price will breakout and then reverse in an opposite direction, the volume of the asset also will have to decrease. Example of rising wedge can be seen in the screenshot below.
[screenshot taken from tradingbview]
In other to identify the rising wedge pattern on a chart, you have to draw two trend lines one at the top of the price and the other below the price.
Be certain that this trend lines touches at least 5 points for it to be a valid wedge. It can be 3 touch above and 2 touch below. It can also be more than 5 touch but it must not be less than 5 touch.
The Falling Wedges
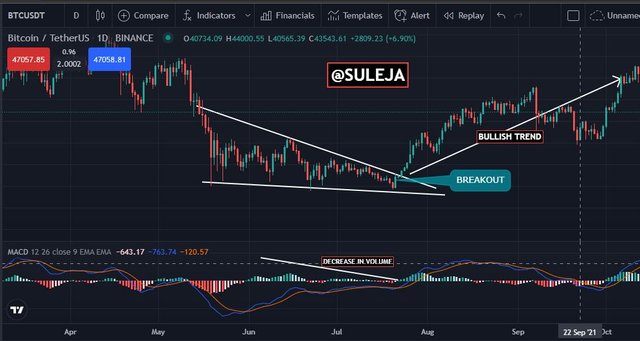
When we talk about the falling wedge, we also refer it to the bullish form of wedge pattern. It is so called because the end result of this type of wedge is a bullish movement in the price of an asset. The falling wedge is a movement of price in a downward direction or downtrend or beardish direction which after encountering a breakout, the said movement will reverse to an opposite direction I.e movement will change to upward direction or uptrend or bullish direction.
The falling wedge uses the two trendline as we have discuss above, one acting as a support and the other acting as a resistance. The lines continue to move until they meet (Converge) each other at the end. When this is about to happen, the price will breakout and then reverse in an opposite direction, the volume of the asset also will have to decrease. Example of falling wedge can be seen in the screenshot below.
[screenshot taken from tradingbview]
HOW TO IDENTIFY THE FALLING WEDGE
In other to identify the rising wedge pattern on a chart, you have to draw two trend lines one at the top of the price and the other below the price.
Be certain that this trend lines touches at least 5 points for it to be a valid wedge. It can be 3 touch above and 2 touch below. It can also be more than 5 touch but it must not be less than 5 touch.
When identifying this wedge, take also into consideration the volume and watch it closely as it is suppose to be decreasing.
Do the breakout of these Wedge Patterns produce False Signals sometimes? If yes, then Explain how to filter out these False signals.
I will say yes to this question. The Reason is stated below and a way out as well.
It may interest you to know that false breakout are present in most trading market. hence since this cannot be eradicated from our day-to-day trading, it would be better if we think of ways to trade without getting caught up in false breakout.
When we talk about false signal we are referring to signals given by the wedge pattern which are sometimes very disastrous to a trader. They signal will lead you into entering or exiting a trade the wrong time. So this is always seen in most pattern of trade and the case of the Wedge pattern is not an exception. So to answer the above question, the breakout of wedge pattern also produce fale signal. This false signal can be filtered by introducing an indicator to the trade.
Show full trade setup using this pattern for both types of Wedges.( Entry Point, Take Profit, Stop Loss, Breakout)
For the purpose of the lesson, the token I will be using from the presentation will be the BTC/USD token. which is currently undergoing a downtrend in the price.
TRADE SETUP FOR RISING WEDGE
A sell entry setup is usually the case in the rising wedge. This is because the movement before breakout is usually in an upward direction and the breakout creates room for downward movement or bearish trend. Sell entry is usually set when the trend is moving in a downward direction. So let's see the sell entry setup chart below.
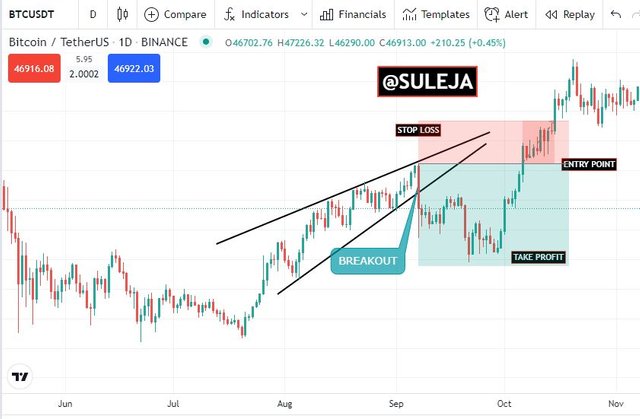
[screenshot taken from tradingview]
TRADE SET UP FOR FALLING WEDGE
A buy entry setup is usually the case in the falling wedge. This is because the movement before breakout is usually in a downward direction and the breakout creates room for upward movement or bullish trend. Buy entry is usually set when the trend is moving in an upward direction. So let's see the buy entry setup chart below.
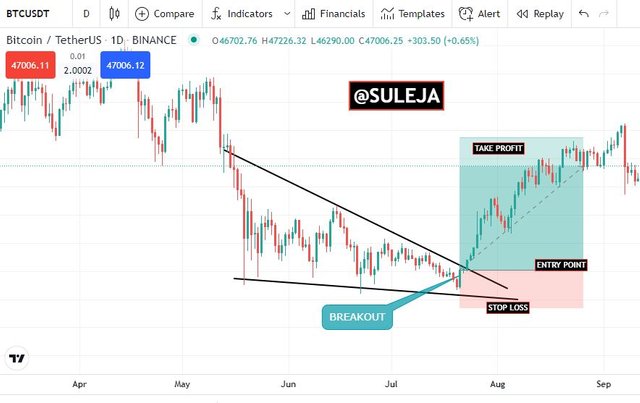
[screenshot taken from tradingview]
CONCLUSION
In the lesson, I’ve learned enough about the wedges patterns and I’ve come to understand what Wedges pattern is all about.
The class was really wonderful all thanks to prof.@sachin08 for such a good and nice explanation.