Club5050-Using MACD Indicator In Trading Crypto Assets
Hi everyone.
Trading cryptocurrencies is now a fundamental aspect of the blockchain and cryptocurrency market in general. Trading and investing is what everyone goes by to generate some profits from the trade or invest made. But before one can involve him/her self into this trading he/she has to know and understand what the crypto market is all about, knowing what it takes to invest or trade in crypto assets and a whole lot about the system.
Furthermore, to make your trading more serious and prosperous you need to learn some basic and necessary things about the trading itself. Things like learning how to use technical indicators in carrying out trades. These indicators help’s traders a lot in the system. They tell an investor or a trader when to purchase an asset or when to sell an asset when use correctly.
There are many types of these technical indicators use in making analysis about crypto assets and the general crypto market as well, some of these indicators include MACD, RSI, Median etc. All these are technical indicators use to make analysis about the crypto market. But today, I want to talk more about the MACD indicator, what it is, how to use it, how to add it to your chart and a whole lot about it.
MACD Indicator is a technical indicator and the short form of Moving Average Convergence Divergence. It is a strong trend based technical indicators that is use to determine the differences in price of crypto assets. Investors and traders make good use of this particular indicator by using it to analyze the historical price information of the crypto asset. This analysis will tell whether the current trend of the asset is up or down which brings investment opportunities to traders.
The indicator helps in detecting moving averages which indicates a new trend. After all, finding a trend either bullish or bearish is the main priority of trading or investing.
The indicator usually comes with a histogram which differentiates between the MACD and its signal line. The histogram is always above the MACD’s baseline if the MACD is above the signal line and vice versa. The histogram detects how strong the momentum of a bearish or bullish trend is.
The MACD indicator comprises of three different features which carry out different functions all together, these features include MACD line, Signal line and a Histogram.
• The MACD line separates the 12 EMA period and a 26 EMA period.
• The signal line which is calculated by a 9 period EMA of the MACD line. It being the average of the last 9 period of the MACD line. It is sometimes referred to as a smoother MACD line.
• A histogram which shows the behavior between the MACD line and signal line. The histogram is made up of red and green colors. The plots are green in color and goes above the zero line when the MACD line is above the Signal line and red when the Signal line is above the MACD line. At the point of intersection of the MACD and Signal line the histogram is at a zero.

As we are all aware, there is no 100% assurance in predicting the trend of the crypto market. So don’t think the MACD indicator is extraordinary or gives 100% assurance that the price of an asset will fall or rise.
But from many traders and investors who have used the MACD indicator has testified that it is a good indicator for trading.
The crypto market is highly volatile which makes the values of crypto assets not stable but with the use of MACD indicator it will identify the trend of the crypto asset and enable you to enter or exit the market at the right point.

In this session I will showing how to add the MACD indicator to your chart. I will be using the tradingview platform in doing so.
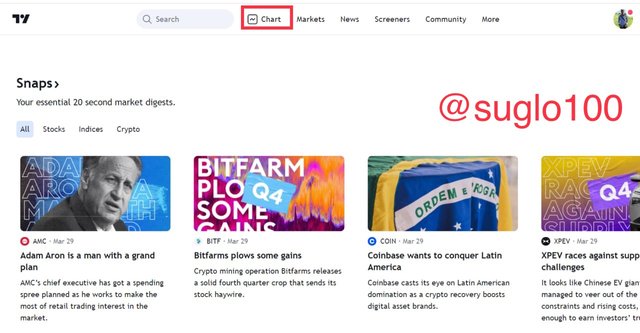
• From the homepage of tradingview, you click on chart to launch the chart and you can change the crypto pair to your desired crypto pair like BTC/USDT.
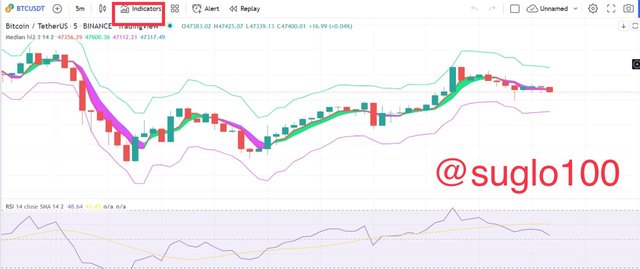
• After launching the chart you then click on the indicator button at the top of the chart.
• Now type in the name of the indicator which is MACD in the search button and click on the indicator as shown from the results of the search.
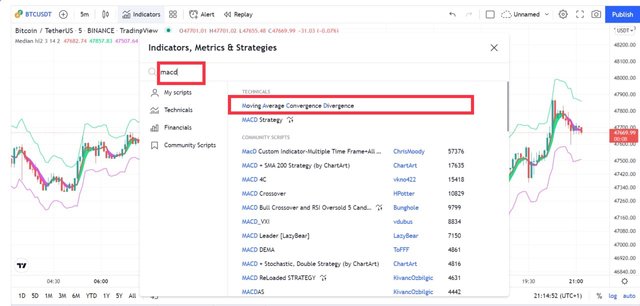
• Now the indicator will be added to your chart successfully.
After adding the indicator to your chart you can also check on the settings of the indicator to change somethings to suit your trading style.
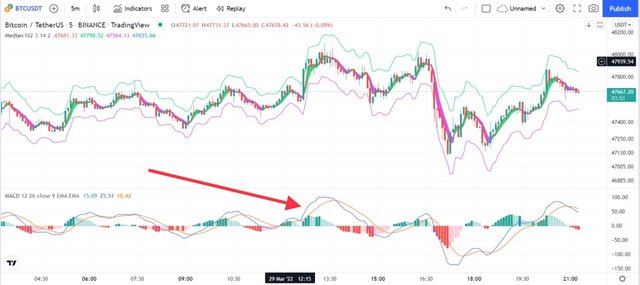
Looking at the chart with the MACD indicator, we can see that the indicator is made up of a histogram, signal and MACD line.
The MACD line which has appeared blue shows the difference between two moving averages. It is considered as the faster moving average which measures the difference between the 12 period moving average and the 26 period moving average.
The signal line which is also orange in color is considered the slower moving average which is the moving average of the MACD line. Under normal circumstance, the 9 period moving average is used for the signal line.
The histogram which is also a graphical representation of the difference between the MACD line and the signal line. The histogram measures the distance between the MACD line and the signal line and gives an early signal when a crossover is about to happen.
It is located close to the zero line which traders can use to detect price reversals or trends. When MACD line crosses the signal line, the histogram reduces to the zero line which signifies a price reversal.
The zero line which is located at the midpoint of the histogram. When there is a cross between the MACD line and the signal line, the histogram approaches the zero line which signifies a trend reversal. Traders and investors use the histogram to determine price reversal.

The MACD indicator is a good indicator that can help detect trend reversals and trading opportunities in the crypto market. But it will be more nice if the MACD indicator is paired with other technical indicators like RSI, median indicator etc. This can help facilitate productive trading and filtering out false signals.
The combination of the MACD indicator and other technical indicators is very nice as they will help give more accurate results on market trends and price volatility in the market. If both indicators signifies a bullish trend at the same time, it means there is a 95% of the market going bullish, hence a perfect point to sell your assets.
Thank You All!!
It is very important for those who are trading to know about this Moving Average Indicator. Thank you very much for discussing a very important topic.
You are welcome
Understanding Indicators are very important in trading cryptocurrency and MACD indication is one of the most popular one to use and you have explained how to use it in the easiest way possible. Thank you for sharing
Bro your analysis is Soo detailed and this post was definitely helpful. I only make use of the Bollinger bands indicator but that's to you I can start adding the macd. Day by day I learn more and more and I'm grateful for that. Keep up the good work
I’m pleased 😊
Twitter Link
Moving Average indicator is fit to learn by beginner, because they provide the average data that we can easy to understand. Thanks for sharing
MACD is a very popular indicator, I personally use this indicator too. Thank you so much for discussing this indicator.
You are welcome and thanks for also going through