Crypto Academy / Season 4 / Week 1 - Homework Post for [@sapwood]: Onchain Metrics


On-Chain Matrics is completely different from normal trading. On-chain matrics data not only look at buyers and sellers that trade on Crypto exchanges.
On-Chain Matrics is a real fundamental analysis concept that collects insight data from the blockchain like how many coins and from how long they still held in a wallet and not moved to another wallet, the daily generated new crypto wallet address, the transactions in volume, and such many more, according to this how the price of that crypto coin is performing so that accordingly investor can able to determine the Bullish and Bearish signals.
| 𝐐𝐮𝐞𝐬𝐭𝐢𝐨𝐧 𝟏: 𝗪𝗵𝗮𝘁 𝗶𝘀 𝗮 𝗛𝗢𝗗𝗟 𝘄𝗮𝘃𝗲, 𝗵𝗼𝘄 𝗱𝗼 𝘆𝗼𝘂 𝗰𝗮𝗹𝗰𝘂𝗹𝗮𝘁𝗲 𝘁𝗵𝗲 𝗮𝗴𝗲 𝗼𝗳 𝗮 𝗰𝗼𝗶𝗻(𝗕𝗧𝗖, 𝗟𝗧𝗖) 𝗶𝗻 𝗮 𝗨𝗧𝗫𝗢 𝗮𝗰𝗰𝗼𝘂𝗻𝘁𝗶𝗻𝗴 𝘀𝘁𝗿𝘂𝗰𝘁𝘂𝗿𝗲? 𝗛𝗼𝘄 𝗱𝗼 𝘆𝗼𝘂 𝗶𝗻𝘁𝗲𝗿𝗽𝗿𝗲𝘁 𝗮 𝗛𝗢𝗗𝗟 𝘄𝗮𝘃𝗲 𝗶𝗻 𝗕𝘂𝗹𝗹 𝗰𝘆𝗰𝗹𝗲𝘀? |
What Is A HODL Waves?
HODL wave is a type of chart that provides even very small details in graphical representation for circulation of the coin age, it also provides in-detail data for circulation of the coin behavior from holding to spending.
The HODL wave chart contains Unspent Transaction Output (UTXO) Age Distribution which categories the age of the coin like 1 year to 2 years, 2 years to 3 years, to check recent transaction we can refer to age category like 1 day to 1 week, last 24 hours.
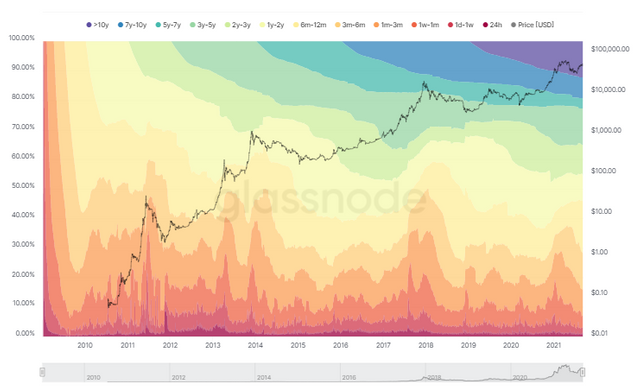
Depending on the ages that we select, further, HODL wave also provides the information of coin supply which different type of Colour bands which help to understand the maturity of the coin for that specific age which we have selected.
When Coin maturity gets change then depending on the behavior of demand or supply it will further display in HODL waves color bands.
HODL Wave platform is good to perform fundamental analysis for a particular crypto coin which reduces unnecessary noises and gives a direct status of the coin.
How to calculate the age of a coin in a UTXO accounting structure?
The calculation age of the coin in the UTXO model is depending on when it was last moved during the transaction.
Whenever coins are sent the respective network generates a new UTXO and the age in UTXO show which transaction was first added and represents when it was last moved. The UTXO data help analysts to monitor when the last time the coin was moved.
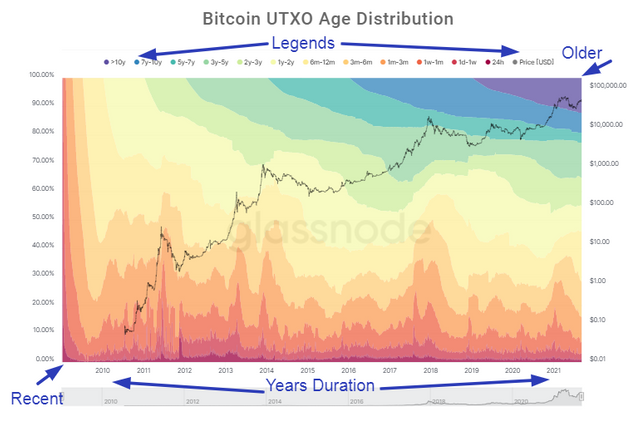
UTXO model contains Hold Waves and as mentioned they represent the age of the coin with color bands. Here, the lower color bands indicate the most recent transaction that was made and upper color bands show the coins that have not transferred for a long time and are older.
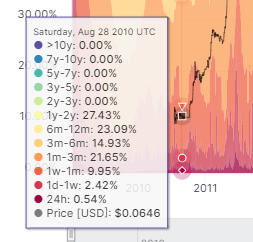
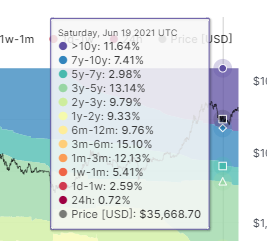
Look at the both above image, when we move the pointer from the left bottom to the top right, it will show us transaction data for that day and in between particular time frames.
Legends:- Here, you can select and unselect a particular year so that data will only show as per the requirement.
Black Line:- Black line in the chart shows the price of the coin in the pair of USD.
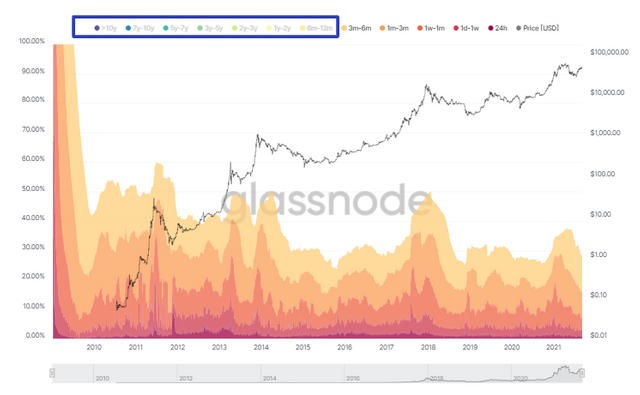
Here, we can see after clicking on the legends from 6 months to >10 years they are now invisible and only data shows for which legends are selected. Legends are the type of color that has given to a particular year duration.
Every Transaction that is made creates a new UTXO and active supply is decided by calculating the quantity of coins that are transacted within the specified time duration.
Active Supply = value (all UTXO is e − ecreated for selected age band)
How To Understand A HODL wave In Bull Cycles?
In simple words the more coins hold in a wallet, there will be less demand and supply for that particular crypto coin, and then the result the coin will be bullish.

As shown in the above image, the lower band are the recent transaction made in the last 24 hours, 1 day the older coins that are not transacted and holding in a wallet, when these upper color bands increase, then we can understand that there will be less demand and supply in a market and then from this, we can conclude that the Bull cycle may start.

| 𝗤𝘂𝗲𝘀𝘁𝗶𝗼𝗻 𝟮: 𝗖𝗼𝗻𝘀𝗶𝗱𝗲𝗿 𝘁𝗵𝗲 𝗼𝗻-𝗰𝗵𝗮𝗶𝗻 𝗺𝗲𝘁𝗿𝗶𝗰𝘀-- 𝗗𝗮𝗶𝗹𝘆 𝗔𝗰𝘁𝗶𝘃𝗲 𝗔𝗱𝗱𝗿𝗲𝘀𝘀𝗲𝘀, 𝗧𝗿𝗮𝗻𝘀𝗮𝗰𝘁𝗶𝗼𝗻 𝗩𝗼𝗹𝘂𝗺𝗲, 𝗡𝗩𝗧, 𝗘𝘅𝗰𝗵𝗮𝗻𝗴𝗲 𝗙𝗹𝗼𝘄 𝗕𝗮𝗹𝗮𝗻𝗰𝗲 & 𝗦𝘂𝗽𝗽𝗹𝘆 𝗼𝗻 𝗘𝘅𝗰𝗵𝗮𝗻𝗴𝗲𝘀 𝗮𝘀 𝗮 𝗽𝗲𝗿𝗰𝗲𝗻𝘁𝗮𝗴𝗲 𝗼𝗳 𝗧𝗼𝘁𝗮𝗹 𝗦𝘂𝗽𝗽𝗹𝘆, 𝗲𝘁𝗰, 𝗳𝗿𝗼𝗺 𝗮𝗻𝘆 𝗿𝗲𝗹𝗶𝗮𝗯𝗹𝗲 𝘀𝗼𝘂𝗿𝗰𝗲(𝗦𝗮𝗻𝘁𝗶𝗺𝗲𝗻𝘁, 𝗖𝗼𝗶𝗻𝗺𝗲𝘁𝗿𝗶𝗰𝘀, 𝗲𝘁𝗰), 𝗮𝗻𝗱 𝗰𝗿𝗲𝗮𝘁𝗲 𝗮 𝗳𝘂𝗻𝗱𝗮𝗺𝗲𝗻𝘁𝗮𝗹 𝗮𝗻𝗮𝗹𝘆𝘀𝗶𝘀 𝗺𝗼𝗱𝗲𝗹 𝗳𝗼𝗿 𝗮𝗻𝘆 𝗰𝗿𝘆𝗽𝘁𝗼[𝗰𝗿𝗲𝗮𝘁𝗲 𝗮 𝗺𝗼𝗱𝗲𝗹 𝗳𝗼𝗿 𝗯𝗼𝘁𝗵 𝘀𝗵𝗼𝗿𝘁-𝘁𝗲𝗿𝗺(𝘂𝗽 𝘁𝗼 𝟯 𝗺𝗼𝗻𝘁𝗵𝘀) & 𝗹𝗼𝗻𝗴-𝘁𝗲𝗿𝗺(𝗺𝗼𝗿𝗲 𝘁𝗵𝗮𝗻 𝗮 𝘆𝗲𝗮𝗿) & 𝗰𝗼𝗺𝗽𝗮𝗿𝗲] 𝗮𝗻𝗱 𝗱𝗲𝘁𝗲𝗿𝗺𝗶𝗻𝗲 𝘁𝗵𝗲 𝗽𝗿𝗶𝗰𝗲 𝘁𝗿𝗲𝗻𝗱 (𝗼𝗿 𝗰𝗼𝗿𝗿𝗲𝗹𝗮𝘁𝗲 𝘁𝗵𝗲 𝗱𝗮𝘁𝗮 𝘄𝗶𝘁𝗵 𝘁𝗵𝗲 𝗽𝗿𝗶𝗰𝗲 𝘁𝗿𝗲𝗻𝗱)𝘄.𝗿.𝘁. 𝘁𝗵𝗲 𝗼𝗻-𝗰𝗵𝗮𝗶𝗻 𝗺𝗲𝘁𝗿𝗶𝗰𝘀? 𝗘𝘅𝗮𝗺𝗽𝗹𝗲𝘀/𝗔𝗻𝗮𝗹𝘆𝘀𝗶𝘀/𝗦𝗰𝗿𝗲𝗲𝗻𝘀𝗵𝗼𝘁? |
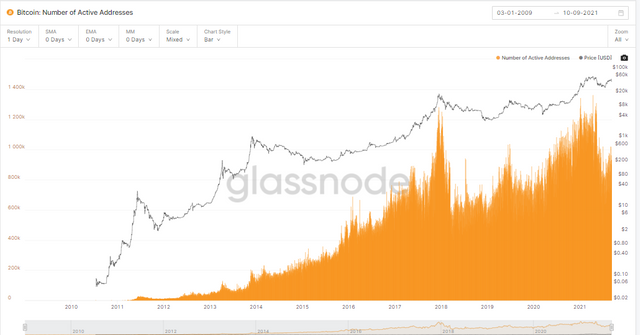
In order to demonstrate Active Addresses, Transaction Volume, NVT, Exchange Flow Balance & Supply on Exchanges as a percentage of Total Supply, etc, I will be using On-chain data Matric platform Glassnode.
Below is the basic chart view of On-chain data Matric platform Glassnode, the color code on the right side provides information of meaning both lines that we can see on the Chart, then according to our need we can set duration for a short team or long term.

Daily Active Addressess.
𝗗𝗮𝗶𝗹𝘆 𝗔𝗰𝘁𝗶𝘃𝗲 𝗔𝗱𝗱𝗿𝗲𝘀𝘀𝗲𝘀 - Short Term
In order to understand the short-term Active Address, we have selected Litecoin and set the time period for the last 3 months.
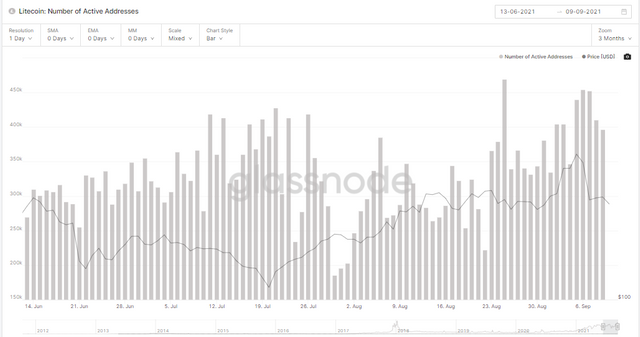
Here, we have set the duration for the last 3 months to analyze the active address, in the above image we can see the data available for the last active address till the dates. The bar represents the Active addresses.
In between JULY 2021 and August 2021, we can also see that there was a huge drop and gain back in Active Address. However, it does have much effect on its price.
𝗗𝗮𝗶𝗹𝘆 𝗔𝗰𝘁𝗶𝘃𝗲 𝗔𝗱𝗱𝗿𝗲𝘀𝘀𝗲𝘀 - Long Term
In order to understand the short-term Active Address, we have selected Litecoin and set the time period for 2 years. For the long-term analysis, we have set a month-wise bar chart.
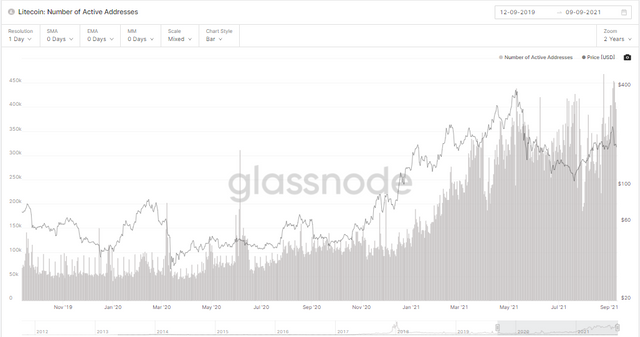
The analysis part with a 2-year chart is looking very simple as we can see the coin price from the last 2 years is moving according to the active addresses. Till March 2021 the price was above the Active Address, but then due to the crypto bullish trend starting in 2021, the Active address seems to be increases and the result the transaction also increased, there was some fluctuation seen between March 2021 to September 2021.
Transaction Volume.
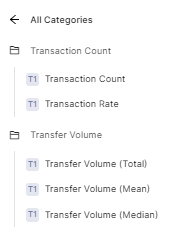
In the On-chain data Matric platform Glassnode, there are 2 category and their subcategories we can see in Transaction.
Transaction Count: In these sub-categories are Transaction Count, Transaction Rate.
Transfer Volume: In these sub-categories are Transfer Volume total, Mean, Median.
Transaction Count and subcategory Transaction Count.
Short Term
The number of transactions from the last 3 months provides us a short-term view of information on the transaction that was successfully made.
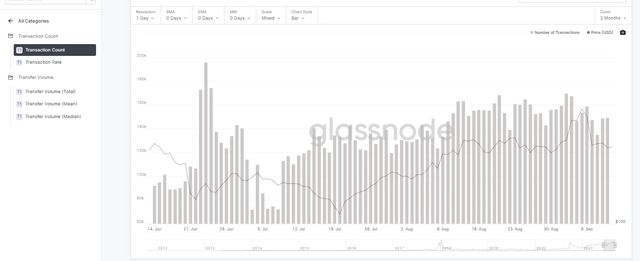
As we can see in the graph due to a lot of transactions the price of assets is moving like a roller coaster.
Long Term.
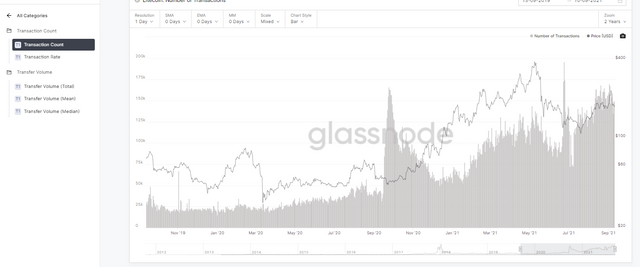
For the long term we can see details in the last 2 years, here we can see till September 2020 due to less transaction price was moving well, but then after that due to a lot of transaction started the price has moved well as compared to the before September 2020.
- Transaction Count and subcategory Transaction Rate.
Transaction Rate provides us details about the rate for the number of transactions per second.
Short Term
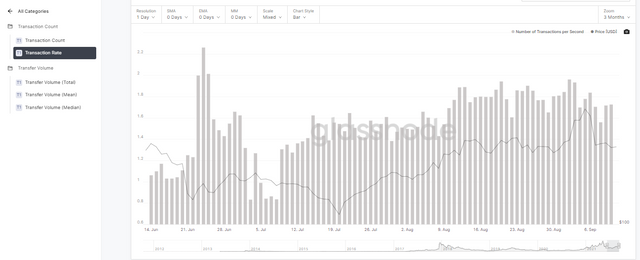
Las 3 month chart, the information is available the rate of transaction per second and how the assessments price was moved accordingly. The only successful transaction has counted.
Long Term
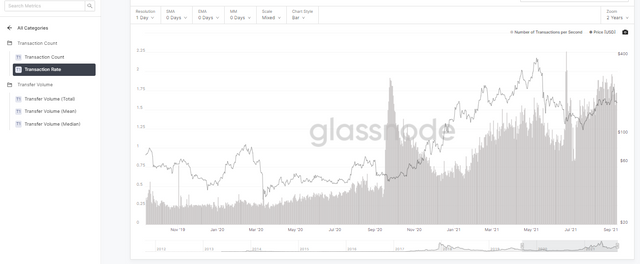
Similar to the 3 months, this information is available from the last 2 years for a long term, the rate of transaction per second, and how the assessments price was moved accordingly. The only successful transaction has counted.
- Transfer Volume and subcategory Transfer Volume Total.
Short Term
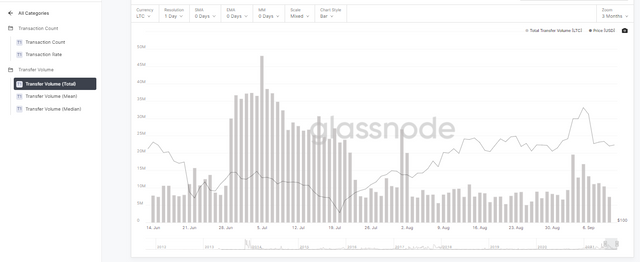
Last 3 months' data for the volume of total transfer made for a coin, the only successful transfer is counted.
From 28th JUNE 2021 to around 20 JULY 2021 there is a huge transfer made due to which the price of assets turns in bearish. But, later on, we can see an improvement in the price due to less transfer made. Here, Only successful transfers are counted.
Long Term.
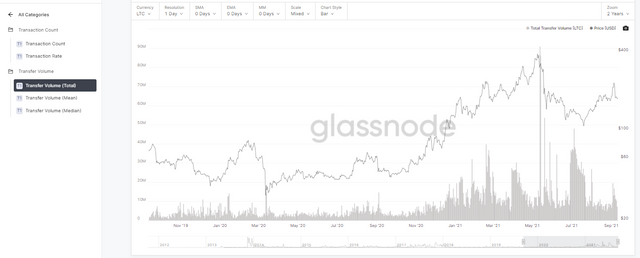
Last 2 years data for the volume of total transfer made for a coin, the only successful transfer is counted. Till May 2021 the transfer was low hence the price was bullish and that after that the transfer volume increased hence we can see that the bearish trend for a while. Here, Only successful transfers are counted.
- Transfer Volume and subcategory Mean Transfer Volume.
Short Term.
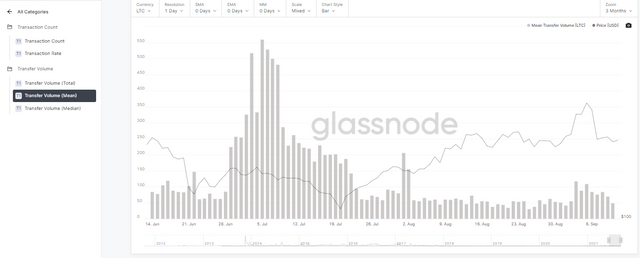
Mean state for average, Mean calculated by the adding all numbers together then the result will further divide them by value of numbers.
The above image represents the Mean Transfer volume for the selected range. Again, we can see the same here that from 28th JUNE 2021 to around 20 JULY 2021 there is a huge transfer made in mean calculation due to which the price of assets turns in bearish. But, later on, we can see an improvement in the price due to less transfer made. Here, Only successful transfers are counted.
Long Term.
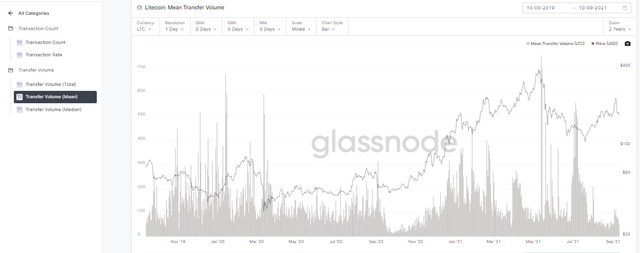
Last 2 years data for the Mean Transfer volume was made for a coin, the only successful transfer is counted.
- Transfer Volume and subcategory Median Transfer Volume.
Short Term
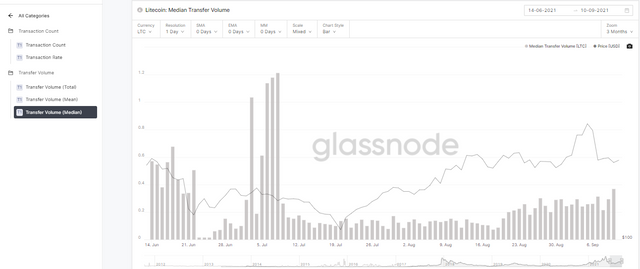
Median is another measurement of calculation in which numbers are set in order from small to big and then middle number selected and then the value of the sum of middle number further divided by 2. Based on this calculation we can see the data available for the last 3 months. Here, Only successful transfers are counted.
Long Term
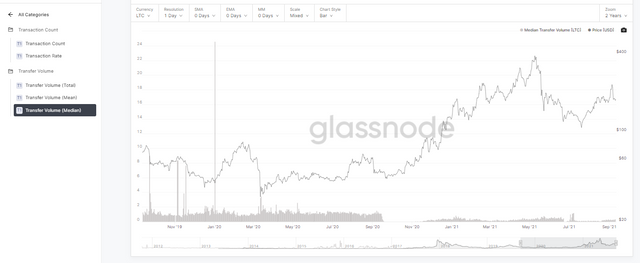
Based on the mentioned above calculation of Median we can see long term data which for last 2 year. As per Median Transfer Volume, we can see the demand and supply for the coin in the selected range.
NVT Ratio.
Due to the Free account, the 3 months chart is not available on Glassnode, so here we will check data available in the long term which is 2 years.
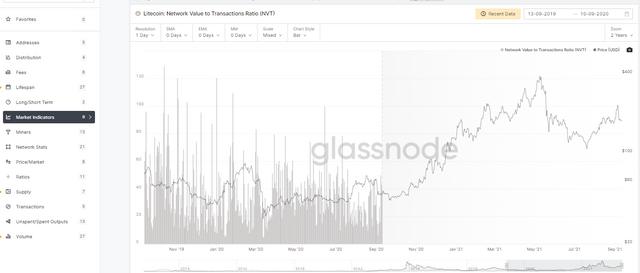
The Network Value to Transaction (NVT) is one of the indicators that represent the connection between transfer volume and market capitalization and it is calculated by market cap dividing with the transferred volume in USD.
When Network Value to Transaction (NVT) goes up which means the value being transferred on the specific network. It can show reliable growth or a possible price pump. However, when When Network Value to Transaction (NVT)is low then we can say it's a bearish signal. According to this, we can see the available data for the last 2 years.
NVT Ratio = Market Cap in USD / Transaction Volume in USD = All UTXO price value in USD / Price of all output that spent in USD.
Exchange Balance & Supply.
This information is represented of the coin that is held on the Exchanges address, due to the free account we can not see the recently available data on Glassnode, hence we check the data available for the last 2 years, below is its graphical view.

We do not have recent data, but from the above image, we can see the balance and supply of the coins on the Exchanges address. Blue bars are representing the balance and supply of a coin on Exchanges, wherein the black line shows the coin price.
Based on the information that seen on this chart we can conclude that majority of holding on an Exchanges address which means not transacted, this behavior is pushing the price of the asset in a bullish trend.
| 𝐐𝐮𝐞𝐬𝐭𝐢𝐨𝐧 𝟑: 𝐀𝐫𝐞 𝐭𝐡𝐞 𝐨𝐧-𝐜𝐡𝐚𝐢𝐧 𝐦𝐞𝐭𝐫𝐢𝐜𝐬 𝐭𝐡𝐚𝐭 𝐲𝐨𝐮 𝐡𝐚𝐯𝐞 𝐜𝐡𝐨𝐬𝐞𝐧 𝐡𝐞𝐥𝐩𝐟𝐮𝐥 𝐟𝐨𝐫 𝐬𝐡𝐨𝐫𝐭-𝐭𝐞𝐫𝐦 𝐨𝐫 𝐦𝐞𝐝𝐢𝐮𝐦-𝐭𝐞𝐫𝐦 𝐨𝐫 𝐥𝐨𝐧𝐠 𝐭𝐞𝐫𝐦(𝐨𝐫 𝐚𝐥𝐥)? 𝐀𝐫𝐞 𝐭𝐡𝐞𝐲 𝐞𝐱𝐩𝐥𝐢𝐜𝐢𝐭 𝐰.𝐫.𝐭 𝐩𝐫𝐢𝐜𝐞 𝐚𝐜𝐭𝐢𝐨𝐧? 𝐖𝐡𝐚𝐭 𝐚𝐫𝐞 𝐢𝐭𝐬 𝐥𝐢𝐦𝐢𝐭𝐚𝐭𝐢𝐨𝐧𝐬? 𝐄𝐱𝐚𝐦𝐩𝐥𝐞𝐬/𝐒𝐜𝐫𝐞𝐞𝐧𝐬𝐡𝐨𝐭? |
In this post, I have used the On-chain data Matric platform Glassnode, let's see the overview and experiences about Glassnode.
Glassnode provides in detail and specific On-chain metric data, the site, and graphs are very user-friendly.
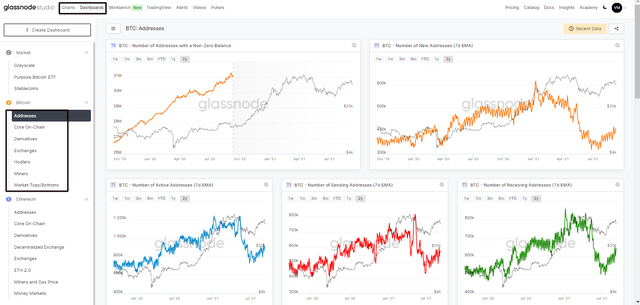
We get a Dashboard option and it's just like a kind of portal in which we can create our own dashboard, also we have a direct option for a specific section like Derivatives, Holder, Miners.
Specific to the Charts, the information available on charts are very much clear and understandable, they have also provided 3 types of Moving Average indications to use.
The problem is for the Free account users, as in regards to the Short Term and Long term analysis the Free account users do not have access to all categories and they can only use species that are available, in order to take full access then they will have to upgrade the plan.
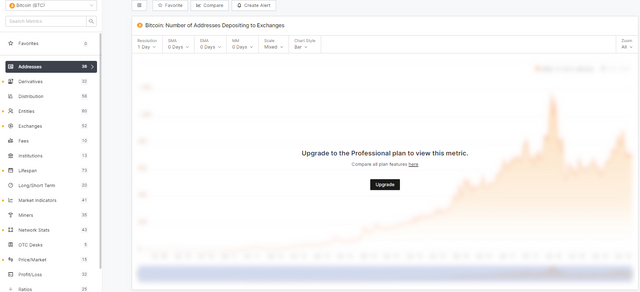
The next problem for Free account users is that for some category they will not see the most recent data, in order to see recent data then they will have to upgrade the plans.

Maybe the image will be not given a clear view, it is actually a notification that show above the chart for free users, it state "Upgrade to the Advanced plan to see most recent data. High resolution and more frequently updated chart available on the Professional plan. Upgrade your plan"
In regards to the short term and long term, for free account users, the long term analysis will be helpful if they have good knowledge of it as experienced investors can able understand and predict from the past data, however as informed for the short term so free account users will not get access for recent data so it is not good for short term analysis.
There is no option to create a watchlist, but as I mentioned you can create your Dashboard, and then you can monitor the metrics that you have selected, see below how I have created the Dashboard.
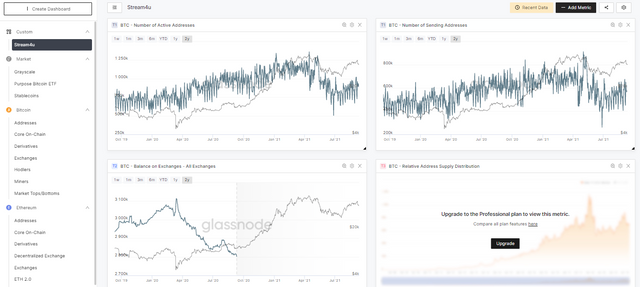
Again the free users can not have full matrics access and they can only configure which is available, also even we create a Dashboard, the free accounts can not see the recent data, there are a few more specific limitations we can see like;
-> No Full access on all Matrics for Free Account Users.
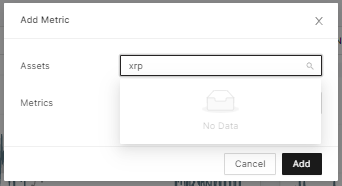
-> Not all coins are supported like XRP.
The attractive feature in Glassnode is Glassnode Academy.
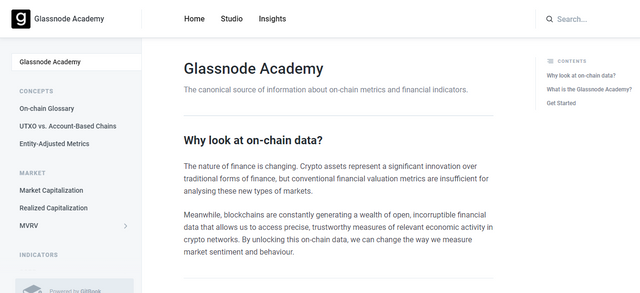
In Glassnode Academy, they have provided detailed and a lot of information about on-chain metrics and financial indicators. They have given all information about UTXO, On-Chain Matric data, how the information is calculated, how the data is useful for investors and all these everything is mentioned in very simple terms.
Disclaimer.
This article is just for educational purposes and not any suggestion for investment. Please do your own research before go for any investment
#sapwood-s4week1
#cryptoacademy
#india
Cc: @sapwood
Thank You.
@stream4u
You have been upvoted by @sapwood, a Country Representative from INDIA. We are voting with the Steemit Community Curator @steemcurator07 account to support the newcomers coming into Steemit.
Engagement is essential to foster a sense of community. Therefore we would request our members to visit each other's posts and make insightful comments.
Thank you