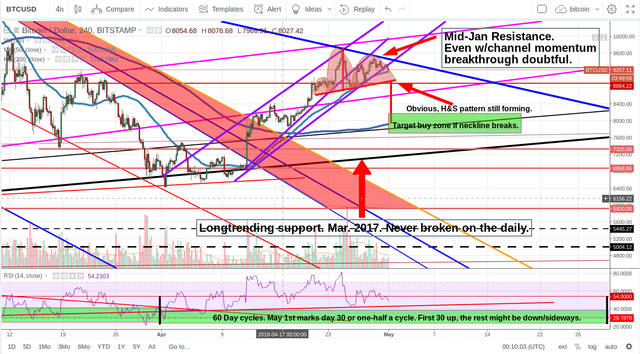
New Bitcoin Buy Zone Identified! $7500-$8000

I'm sorry for the messy chart folks. I do a lot of work on my charts trying to get these calls right.
Let's go through some of this stuff and I'll show you what I've come up with.
First off, one of the reasons why I put off posting this chart was:
-A) because the Head-and-Shoulders that I'm about to show you was still so incomplete and
-B) with all that bullish sentiment here I was not sure that it would complete.
So we were in an uptrend channel (PURPLE). Even with that momentum, the charts were showing me we'd probably not go much higher than 9.5-10k. Why? See that BLUE down-trending line? That's been there since mid-Jan and the bullish momentum already seemed to be fading around 9.3k. But even if we did break the BLUE, above it on the DAILY stood the 200dma, a formidable foe for those bulls to be sure. It stood at 10k.
Ole' BLUE was tested and the bulls knocked their heads so hard up against it that it sent them down and out of the PURPLE channel. A bearish sign to be sure. But this was just the start. It also helped to confirm that another bearish signal was forming and that is the Head-and-Shoulders you see.
Now if we break that neckline, it should take us down to the 200dma (on the 4hr now) or lower. I have outlind your buy target zone in the chart.
One more thing to mention. See my RSI chart? I noted about half a year or so ago that ole' Bitcoin likes it's 60 day cycles. Sometimes these cycles are extended, such as was the case in the beginning of this year. But I think I have found it attempting to get back on track. Whereas last year the cycles were 75% bullish (meaning the first 45 days were UP and the last 15 days were DOWN), this year I have found that so far the cycles are 50/50 bull/bear. So, the first 30 days seem to cycle UP and the last 30 DOWN. Tomorrow, May 1st, marks the halfway point of this cycle. It could be something, and then maybe not. Nevertheless, I thought I'd throw this theory out there for you all to consider.
We'll see what happens here, but for now I've cast my buy nets in the green target zone IF that neckline breaks.
Good luck all and happing trading!