Blockchain Business Intelligence: Price & (Voting, Posting, & Commenting) Behavior Correlation
Details
With the downward trend in price of both Steem and Steem Dollars in the short-term timeframe, I speculated that some users must feel unmotivated to do basic Steemit activities like posting, commenting, and curating contents.
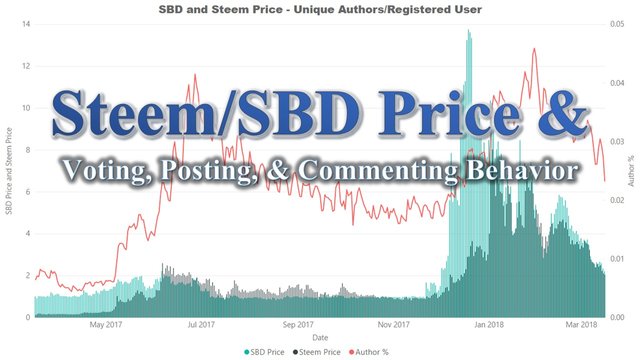
I plotted the daily closing price of Steem and Steem Dollars against statistics of voting, flagging, posting, and commenting in separate charts to establish whether the price really has some impact on behaviors of Steemians.
Outline
To prove/disprove correlation between Steemians' activities and the price of Steem and Steem Dollars, this analysis will look at these data-points:
- 364 Days Cross Analysis Between Voting Activities & Prices Trend
- 364 Days Cross Analysis Between Flagging Activities & Prices Trend
- 364 Days Cross Analysis Between Posting Activities & Prices Trend
- 364 Days Cross Analysis Between Commenting Activities & Prices Trend
The growing number of registered numbers was factored in to avoid skewing the data in relation to the price movements. This will be discussed further in the Scope and Results section.
Scope of Analysis
This analysis was built based on 364 days data between March 17, 2017 to March 16, 2018. The data-points were extracted per month between 7AM GMT to 12NN GMT today March 19, 2018. The prices of Steem and Steem Dollars used were the closing price for each day.
Tools
I used arcange's Steem SQL Database in generating the data. I used the Comments table for posting and commenting related activities, the TxVotes table for voting and flagging activities, and the Accounts table to factor in the growth of the user-base in the analysis.
The prices for Steem and Steem Dollars were taken from the Historical Data feature of CoinMarketCap.
Here are the queries and calculations used to put the data together for this analysis.
/* Accounts Table Query*/
SELECT
    name, created
FROM
    Accounts
GROUP BY
    name, created
- Convert created from datetime to date
=MONTH(created) & "/" & DAY(created) & "/" & YEAR(created)
- Build starting point (count of Steemit accounts)
=COUNTIF(created,"<3/18/2017")
- Count accounts created by date
=COUNTIF(created,"3/18/2017")
- Build a cumulative table through basic sum formula
/* Comments Table Query*/
SELECT
    Comments.author,
    YEAR(Comments.created) AS [YEAR],
    MONTH(Comments.created) AS [MONTH],
    DAY(Comments.created) AS [DAY],
    Count(Comments.author) AS [Posts],
    Count(distinct Comments.author) AS [DistinctCommentAuthor],
    count(Comments.parent_author) AS [ParentAuthor],
    count(distinct Comments.parent_author) AS [DistinctParentAuthor]
FROM
    Comments (NOLOCK)
WHERE
    YEAR(Comments.created) = 2018 AND
    MONTH(Comments.created) = 3 AND
    depth = 0
GROUP BY
    Comments.author,
    YEAR(Comments.created),
    MONTH(Comments.created),
    DAY(Comments.created)
/* TxVotes Table Query*/
SELECT
    TxVotes.voter,
    YEAR(TxVotes.timestamp) AS [YEAR],
    MONTH(TxVotes.timestamp) AS [MONTH],
    DAY(TxVotes.timestamp) AS [DAY],
    Count(TxVotes.voter) AS [Votes],
    Count(distinct TxVotes.voter) AS [DistinctVoter]
FROM
    TxVotes (NOLOCK)
WHERE
    YEAR(TxVotes.timestamp) = 2018 AND
    MONTH(TxVotes.timestamp) = 3 AND
    DAY(TxVotes.timestamp) > 0 AND
    weight > 0
GROUP BY
    TxVotes.voter,
    YEAR(TxVotes.timestamp),
    MONTH(TxVotes.timestamp),
    DAY(TxVotes.timestamp)
Data related to comments was generated by changing the depth parameter, and flags by changing the weight parameter.
Results

Although I started this analysis speculating that there is a correlation between the prices of Steem and Steem Dollar, and the activities related to posting, I still got surprised to see how the line in this chart is almost completely following the trend line of posting activity.
To factor in the growth in the user-base, I did not simply use the number of unique authors posting by day, instead I divided the count of unique authors by the cumulative count of registered users.
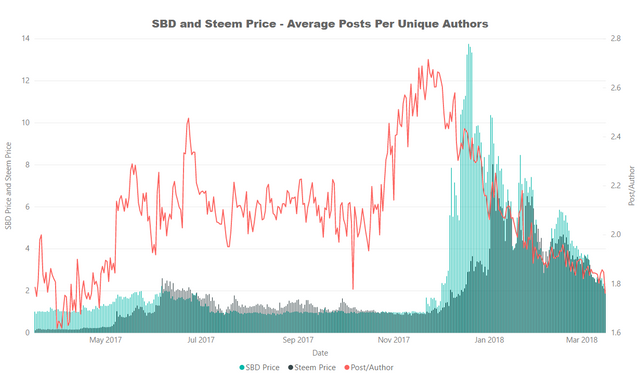
I am showing another perspective in the chart above. This is the average count of post per unique authors, achieved simply by dividing the count of posts by the count of unique authors. This shows that not only do the prices of Steem and Steem dollars affect the percentage of authors posting, it also affects the frequency of posts per unique authors.
This line seems to follow the price of Steem Dollars more in this chart. A slight increase in the price of Steem Dollars starting in November 2017 seemed to have increased the frequency of posting per unique authors quite significantly. The same is true in reverse; when the price of Steem Dollar started to drop in January, the average count of post per unique authors fell significantly. The line seems to be following the Steem Dollar price trend since the beginning of January.
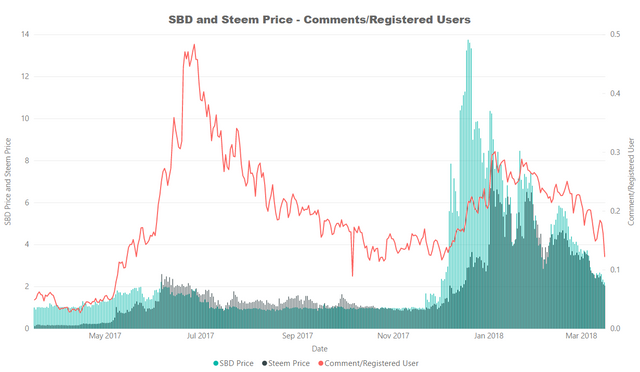
Cross Analysis Between Commenting Activities & Prices Trend
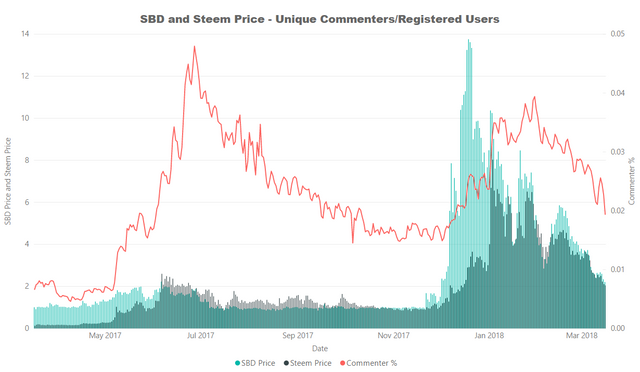
The results in these two charts about commenting activities are very similar to those of posting activities. The count of unique commenter engaging grew from an average of 0.57% of the user-base in May 2017 to 3.45% in July 2017 growing five-folds. The rise is very similar to the movement of the price of Steem from an average of 20 cents in May 2017 to an average of $1.38 in July 2017 growing nearly six-folds.
Cross Analysis Between Voting Activities & Prices Trend
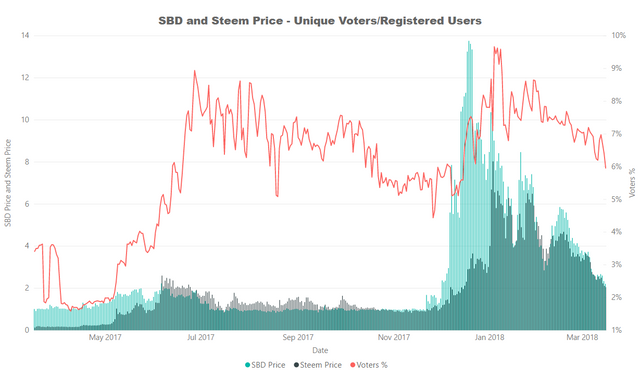
Although we can still see the line in this chart still being affected by the movement in price, the rises and drops are not as steep as the other activities studied in this analysis. Curation rewards are also paid in Steem Power so the impact of price is not observed as immediate in voting behavior as what we have seen in the posting and commenting behaviors.
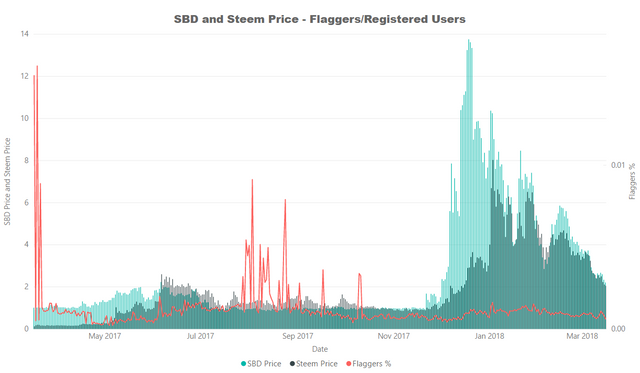
I thought there will most like be no correlation between flagging/downvoting and the price movement of Steem and Steem Dollars. I still showed the results in the chart below for comparison. This activity is based more on users' behavior rather than the price, and there is a very low percentage of the user-base (0.12% daily average) engaging in this activity to be affected by anything other than rises and drops in naughty behaviors (plagiarism, scam, phishing, spam, etc.) by users.
Conclusion
The change in behavior related to the amount of compensation is not surprising. The same has been a subject of studies about employee behavior in the workplace. The entirety of this analysis goes to show that a great majority of users of Steemit are motivated by the amount of compensation they can get from their activities in the platform. I feel this is most specially true for those who joined when the price was at the extreme high, although this analysis is not meant to look into that specifically.
Personally, I don't let the short-term fluctuations in price affect my activities in the platform. A lot of Steemians who did well in the long term stayed consistent with their activities regardless of the price.
Posted on Utopian.io - Rewarding Open Source Contributors
Hey @steemitph I am @utopian-io. I have just upvoted you!
Achievements
Community-Driven Witness!
I am the first and only Steem Community-Driven Witness. Participate on Discord. Lets GROW TOGETHER!
Up-vote this comment to grow my power and help Open Source contributions like this one. Want to chat? Join me on Discord https://discord.gg/Pc8HG9x
Thank you for the contribution. It has been approved.
Hi @steemitph, impressive work, I like your approach to scale the activity by the number of registered users! It's interesting to see that comparably small price variations in the first half of the year seem to lead to similar effects than the large variations at the end of 2017.
You can contact us on Discord.
[utopian-moderator]
Thanks again @crokkon. You're right, the slightest movement a few months back was enough to excite people to up their activities. Steemians are getting harder to please I guess. :-)
No matter what happens... I'll keep steeming and steem to the moon
Now that's the right attitude. Keep it up @oredebby.
same i wont feel in ant dispirited
Right on sir @johnjan1697. It was tough when I was just starting in the platform, so I am okay to keep it up whatever happens to the price.
@steemitph Those who can survive will be the winners in this long distance "Steemithon" :D
You are absolutely right @wilhb81. This ain't a race, more like a marathon. Cheers to your long run :-)
It's not interesting if everything is perfect.
Steemit have regular users everyday, and posts are being created everyday, so Eco System of Steemit is alive because We are active.
That's the key. Keep active and Steem on!
Great post and analysis. Its funny how data can prove assumptions wrong.
Thanks @paulag. It is still very much an honor to be visited by you. You were and still are my inspiration in my journey with data. Thank a million!