Steemit Crypto Academy Contest / S4W1 - Crypto Market Technical Analysis by @steemdoctor1
Hello everybody.
Welcome to this post. I hope that all of you will be good and enjoying your precious health with the grace and blessings of Almighty Allah. Today, I am going to participate in the SteemitCryptoAcademy community and the topic of discussion for today is my favorite one, Crypto Market Technical Analysis. So, let's start the task without any wastage of time.

Technical Analysis
The market of the cryptocurrencies is so much volatile and non-predictable in nature that even the experienced traders and analyst could not be able to assume the next flow of the prices of the crypto assets. This high volatility of the crypto markets tends all of the traders to deal with the risky and critical situations with best decisions in the market. A single wrong decision can harm the traders a lot.
However, there are some techniques to predict the upcoming expected movements of the prices of crypto assets. There are so many methods for this purpose like Fundamental Analysis, Sentimental Analysis, and the most importnat one is the Technical Analysis of the crypto markets. Many of the experienced traders believe on the technical analysis of the market.
Technical Analysis of the crypto market actually deals with the use of various tools and techniques to assume the upcoming moves of the market. These tools and strategies are based on the ling derivations in the form of complex mathematical calculations and problems. Thus, technical analysis is actually the study of the crypto markets to predict the future trends.
According to the technical analysis, the markets of the cryptocurrencies repeat the same cycles in the market. It means that the market flows in cyclic way within the crypto charts. In short, we can say that technical is actually the study of the historical prices to predict the upcoming trends of the market.
As I have explained earlier that the market of the cryptocurrency is so much volatile and risky that no one can exactly predict the upcoming prices of the assets. So, to overcome these risks in the market, the technical analysis of the crypto pairs could be very helpful for the traders to avoid huge loses in the crypto markets.
Technical Analysis is the most preferable and the most important factor that could be able to assure the safe journey of a trader in the crypto market. The most important thing in the crypto trading is to enter the market with proper understanding of the market trend and also proper risk management, the technical analysis helps traders to fulfil both these factors.
Do you have practical knowledge of how to conduct technical analysis? Highlight some of the components of Technical analysis.
In the answer of this question, I would like to say "Yes", I am a regular technical analyst. Whenever, I have to enter the market for a trade, first I do the proper technical analysis of the market because I think that entering the market without any knowledge of the market trend is just like inviting the danger by your own. So, I used to do proper technical analysis of the market before any trade.
Some of the technical analysis tools that are mostly uses by tye crypto traders are discussed below.
First and the most important thing that can be considered by technical analyst is the price chart. The flow of the prices of the cryptocurrency pairs is expressed in the form of candles that are drawn in the charts. This combination of candles on the chart is actually known as Candlesticks chart.
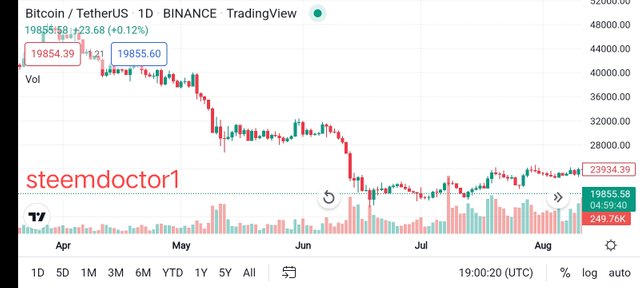
In the above screenshot, you can see a candlestick chart pattern that is actually combination of green and red lines. In this chart, the red line indicates that decline in the prices while the green lines indicate the increase in the prices.
Another important factor while starting the technical analysis is the knowledge of support and resistance levels. These two levels can help the traders to identify the limits in which the market can oscillate. Have a look at the below screenshots.
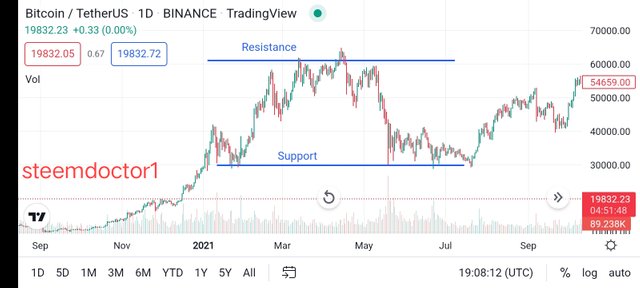
In the above screenshot, you can see that I have mentioned the support and resistance levels on the chart. The resistance levels are actually those levels where the price bounces back after an uptrend. While after a downtrend, the market bounces back from the bottom levels known aa Support levels.
Indicators and Their Importance
The most important technical analysis tools are the technical indicators. Technical indicators are actually the technical analysis tool that can be used to predict the upcoming trends of the market by applying them on the chart. Each technical indicator is a result of very complex mathematical calculations and problems.
Technical indicators play a very important part in the technical analysis of a chart. The technical analysis tool provide the most important entry and exit points in the flowing market of the cryptocurrency assets. Technical indicators are my favourite technical analysis tools.
With the help of the technical indicators, the traders can predict various important factors like the extent of an uptrend and down trend, the breakage of the sport and resistance levels, the possible entry and exit points in the market.
In my crypto trading journey so far, I have used many technical analysis tools and indicators. But the most favourite one is the Triple EMA indicator that is actually known as 'Triple Exponential Moving Averages'. It is one of the most popular technical indicators that are used for the determination of the trends.
Triple EMA is actually a trend base and trend following indicator that can be used for the determination of a downtrend or an uptrend in the market. It actually consist of a single line that is the resultant of three exponential moving averages. Have a look at the below screenshot.
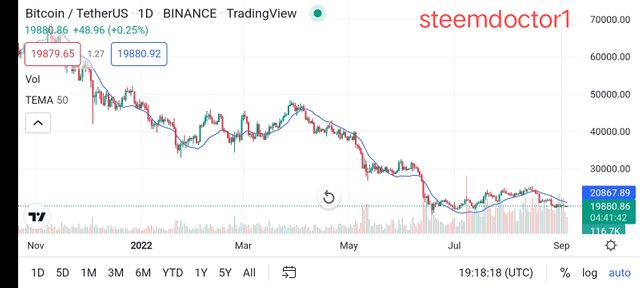
In the above screenshot, you can see that a single line is following the price candles. When the line is above the price candles, it is a signal of a down trend in the market. And when the line is below the candles, it is a signal of an uptrend in the market.
Users can make valuable decisions in the market by keeping an eye on the breakdown of the TEMA line above or below the price action line in the charts. We can also combine this indicator with other technical analysis tools to confirm the signals and make profitable decisions in the market.
Advantages and Disadvantages of Technical Analysis
As we have discussed the technical analysis in detail in the sections, so now we will discuss the advantages and disadvantages of technical analysis for the crypto traders.
With the help of the technical analysis tools, traders can predict the ongoing trend in the market.
The prediction of the upcoming trends is only possible due to the involvement of Technical Analysis.
The historical cycles of the prices can also be determined with the help of the technical analysis tools.
Technical Analysis plays a vital role in the risk management of the trades which is very important while trading in the volatile markets like cryptocurrency
Technical Analysis is very complex and difficult job. Show the traders have to learn properly about the use of Technical Analysis tools before implementing them.
Technical analysis ignores the basics and fundamentals of the Crypto pairs, so this could harm the traders as well.
The signals given by the technical analysis tools are not 100% accurate, so the traders have to be very careful while entering the market.
Conclusions
Technical analysis is actually the study of the historical prices of cryptocurrency assets to predict the upcoming trends and prices of the market. According to technical analysis, the market of cryptocurrencies repeat the cycles again and again and traders can predict these signals for their benefits.
There are many technical analysis tools like technical indicators, price charts, support and resistance levels, and many more. The technical analysis tools can be implemented at the same time to generate the more accurate and profitable signals while entering the market.
I would like to invite my friends @malikusman1, @alihussain07, @numanfarooq7677 to take part in this amazing contest.
Writer: @steemdoctor1

Dear overall your presentation is superb no doubt analysis are very important in the field of Cryptocurrences. Wish you all the best
Thank you so much.
Congratulations, your post has been upvoted by @scilwa, which is a curating account for @R2cornell's Discord Community. We can also be found on our hive community & peakd as well as on my Discord Server
Felicitaciones, su publication ha sido votado por @scilwa. También puedo ser encontrado en nuestra comunidad de colmena y Peakd así como en mi servidor de discordia
Your post is upvoted using the @steemcurator08 account by @chant. Continue making quality content for more support.
Thank you so much.