Fibonacci Tools - Steemit Crypto Academy |S6W4| - Homework Post for Professor @pelon53
Hello everybody.
Welcome to this post. Hopefully, all of you will be good and happy and enjoying your good health with the grace and blessings of Almighty Allah. Today, I am here to present the homework post for dear professor @pelon53 in Week 4 of the Season 6 of the Steemit Crypto Academy. The lecture was nicely explained by the professor and I will try my best to explore it as much as I can. So, let's turn towards our task without any wastage of time.

There are some questions that are asked by the professor as the homework for this week and I will try my best to explain them in the given order.

(01)
Explain in your own words what you mean by Fibonacci retracement. Show an example with a screenshot.
As we all know that the market of cryptocurrency is so volatile that it is very difficult for traders to predict the upcoming movement of the market. There are some technical analysis tools that help traders to make good trading decisions in the market. Fibonacci Retracement tool is also one of the most important technical analysis tools that are a very important tool to make good trading decisions in the market.
Fibonacci was actually a mathematician in Pisa, the city of Italy. Fibonacci Retracement tool is actually based on the golden ratio is a mathematical tool developed by Sir. Fibonacci. His followers claimed that this tool is also applicable in financial markets like crypto markets. In crypto markets, the use case of the Fibonacci Retracement tool is that this tool is used to determine the reversal points of the price during the retracements/pullbacks in a particular trend.
The trending market is actually a market condition during which the price of the asset follows a particular trend (Upward or Downward) continuously. The movement of the market during a trend is not in a straight line, but there are also some pullback points or retracement points where the price quit the ongoing trend and after a retracement/pullback, it goes in the direction of the ongoing trend again.
The retracement points are of unique significance for the traders as they can make entry at low prices during the uptrend and vice versa during the downtrend. The reason behind the occurrence of the retracement points is that these points are actually the profit-taking points for the traders of the market. The Fibonacci Retracement tool helps the traders to determine how far the price is going to retrace and when will the price continue its original trend.
Also, the Fibonacci Retracement tool is applied on the charts of the cryptocurrency to identify the key levels of the market (Support and Resistance). This technical analysis tool actually consists of horizontal lines that represent the Support and Resistance for the price reversals. In the golden ratio of maths, each number is supposed to be 1.618 times greater than the previous number.
The Fibonacci Retracement tool ranges from 0% to 100% where the 100% represents the recent high point and the 0% level represents the recent low point. There are actually three key percentages that are 23.6%, 38.2%, and 61.8%. Besides these main percentages, other percentages like 50% and 61.8% are also popular. Other horizontal lines (percentages) represent the support and resistance levels from where the possibility of price reversal is high.
The Fibonacci Retracement tool is of equal importance for the trend traders, as well as, the counter-trend traders. As during the Bullish trend, the trend traders can find a good entry position at the end of the retracement while the counter-traders can set their Take-Profit point where the price is expected to be reversed. Let's have a look at the below screenshot to see what the Fibonacci Retracement tool looks like.
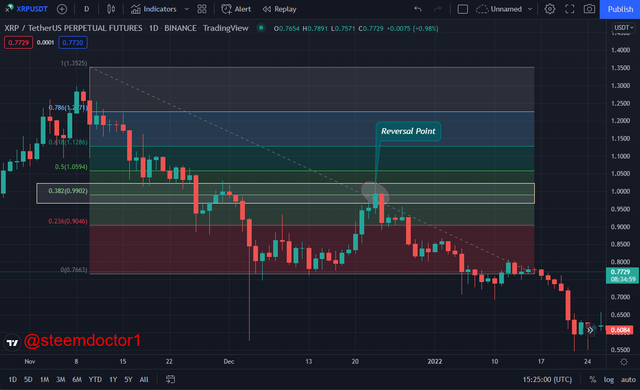
In the above screenshot, we can see that there was a downtrend in the market and I have applied the Fibonacci Retracement tool on the chart for the identification of the price reversal after the retracement/pullback of price upwardly. The tool is drawn from the high point of the trend to the recent low point of the trend. The price of the asset made a resistance point at one of the key levels of the tool which is 0.382. From this point, the reversal point is to be noted. Only two points, the recent high and the recent low are necessary for drawing the Fibonacci Retracement tool.
(02)
Explain in your own words what you mean by Fibonacci extension. Show an example with screenshot.
Another tool that is created on the mathematical principle of Sir. Fibonacci is the Fibonacci Extension tool that is very helpful in determining the distance that the price action can cover in the direction of the trend after the retracement/pullback. This tool can be used along with the Fibonacci Retracement tool to identify the distance of the price that is expected to be covered by the price after the reversal point. The reversal point that is identified by the Fibonacci Retracement tool can act as a good entry point and the point of how far the price is expected to move before the next pullback is represented by the Fibonacci Extension tool and acts as a good Take Profit level.
Thus, we can say that the point that is represented by the Fibonacci Retracement tool can act as a good profit-taking point for the traders who made their entries at the reversal point during pullback. There are also some levels that are represented on the Fibonacci Extension tool just like the Fibonacci Retracement tool. These levels act as support and resistance levels and the traders can market their Take Profit points at these levels as they can represent the possible distance that the price can travel after a pullback. Let's have a look at the below image in this regard.

In the above image, I have marked three points that are a, b, and c. Actually, for the application of the Fibonacci Extension tool, it is necessary to draw the three points that are the start of the trend, end of the trend, and reversal point of the pullback. These points are marked in the above screenshot as a, b, and c, respectively. After drawing these level points, we have to apply the Fibonacci Extension Tool to find the expected distance that the price action line can cover before the next pullback. So, have a look at the below screenshot in this regard.
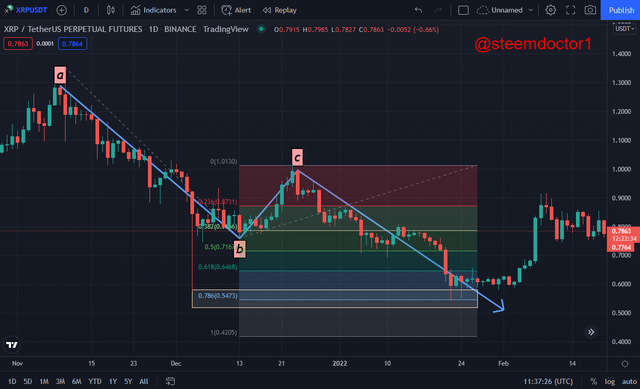
In the above image, we can see that the price of the asset was in a Bearish trend, and during this bearish trend, it made a retracement/pullback point upwardly, and the end of this retracement was determined by the Fibonacci Retracement tool. After that, I have applied the Fibonacci Extension tool to see how far the price can move downwardly (Bearish Trend) after this retracement.
We can observe in the above image that the Fibs levels of the Fibonacci Extension tool are spread from b to c point and then downwardly. We can see that the piece extended up to the 0.786 level of the Fibonacci Extension tool. This point could be considered as the best take profit level for the already executed Short trades in the market.
Thus, the Fibonacci Extension tool can be used along with the Fibonacci Retracement tool to make profitable decisions in the market as we can determine the reversal points after the retracements by the Fibonacci Retracement tool. Likewise, we can determine the position up to which the price can move and set the Take Profit levels at those points.
(03)
Perform the calculation of the Fibonacci retracement, for the levels of: 0.618 and 0.236. Pick a crypto pair of your choice. Show a screenshot and explain the calculation you made.
As we have already discussed that the Fibonacci Retracement tool is actually based on the Fibonacci levels that are specified in the mathematical principle. We only need the recent high and the recent low point of the price to calculate the Fibonacci Retracement. The Fibonacci Retracement tool is drawn from recent high to recent low, and vice versa. There is a formula that is used to calculate the Fibonacci Retracement that is given below.
RX = X + [(1 - %Retrace/100) x (Y - X)]
In this formula,
X is the previous high or low point from where the Fibonacci Retracement tool is started. X is actually the price of the asset at the beginning of the trend.
Y is the point where the price action is reached before entering the retracement/pullback. It is actually the previous low point, in the case of the Bearish Trend.
As we have many times discussed that there are some Fibonacci Retracement levels that are given below.
% Retrace 1 = 23.6%
% Retrace 2 = 38.2%
% Retrace 3 = 50%
% Retrace 4 = 61.8%
% Retrace 5 = 78.6%
These levels are very helpful in the calculation of the Fibonacci Retracements. As the professor has asked to calculate the Fibonacci Retracement for levels 0.618 and 0.236, so I am going to discuss the calculations for these levels.
- Fibonacci Retracement Calculation for 0.618 Level:
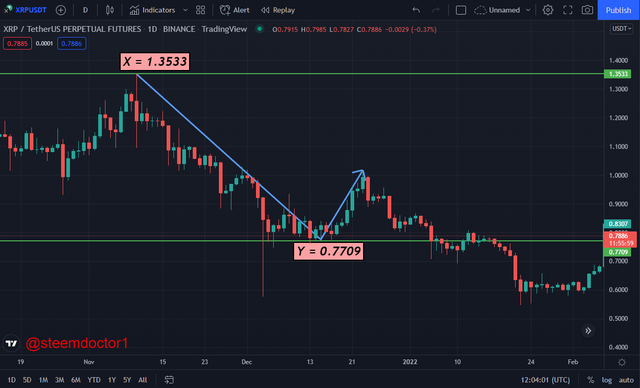
In the above picture, we can observe that I have marked the recent high and low points of the price action. So, According to the Formula that is discussed above.
RX = X + [(1 - %Retrace/100) x (Y - X)] > (i)
As we know,
X = 1.3533$ and Y = 0.7709
So, eq (i) becomes,
RX = 1.3533 + [(1 - 0.618) x (0.7709 - 1.3533)]
RX = 1.3533 + [(0.382) x (-0.5824)]
RX = 1.3533 + (-0.222)
RX = 1.3533 - 0.222
RX = 1.1308
Let's verify the result by applying the Fibonacci Retracement on the chart. So, have a look at the below image.
- Fibonacci Retracement Calculation for 0.236 Level:
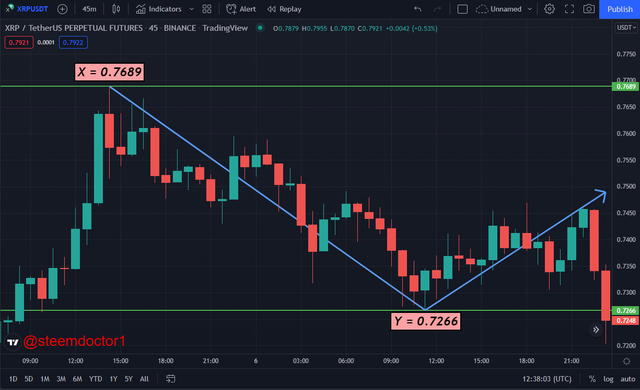
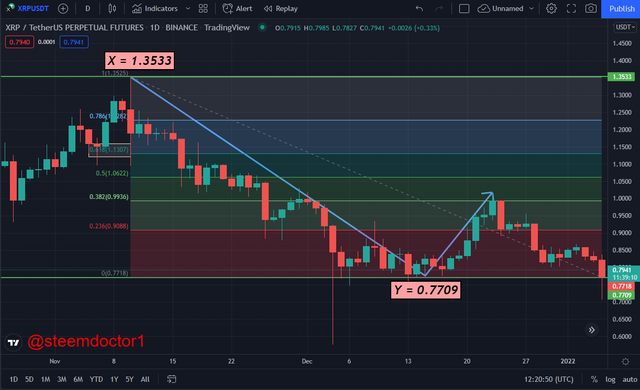
In the above picture, we can observe that I have marked the recent high and low points of the price action. So, According to the Formula that is discussed above.
RX = X + [(1 - %Retrace/100) x (Y - X)] > (i)
As we know,
X = 0.7689$ and Y = 0.7266$
So, eq (i) becomes,
RX = 0.7689 + [(1 - 0.236) x (0.7266 - 0.7689)]
RX = 0.7689 + [(0.764) x (-0.0423)]
RX = 0.7689 + (-0.032)
RX = 0.7689 - 0.032
RX = 0.7369
Let's verify the result by applying the Fibonacci Retracement on the chart. So, have a look at the below image.
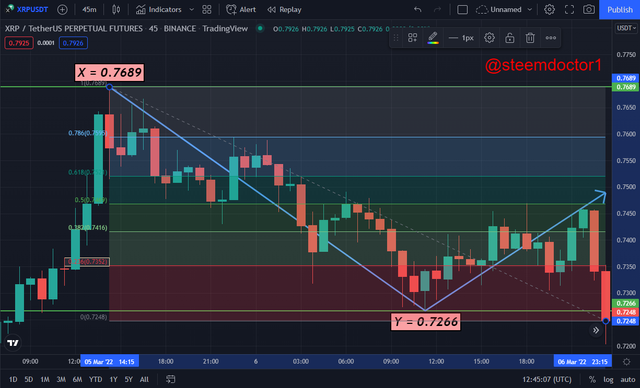
So, it is clear that the calculations of Fibonacci Retracement for the 0.618 and 0.236 levels are corresponding with the tools that are applied on the charts
(04)
On a Live account, trade using the Fibonacci retracement, screenshots are required.
As we have discussed the working details of the Fibonacci Retracement tool in the above sections so now I am going to execute a real trade with the help of this tool. So, have a look at the below image that is taken from the price chart of the ADA/USDT pair.
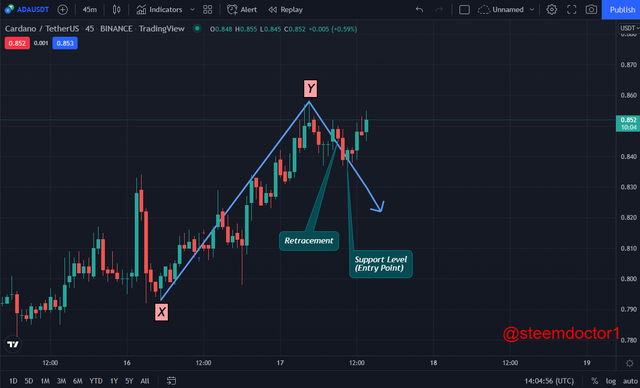
In the above screenshot, we can observe that the price was in a Bullish trend and made a retracement/pullback in the downward direction during this bull movement. The end of the retracement made a Support level that can be considered as a good entry position for the Long trade. To confirm the reversal of the retracement point, I am going to apply the Fibonacci Retracement tool on the chart. So, have a look at the below image in this regard.
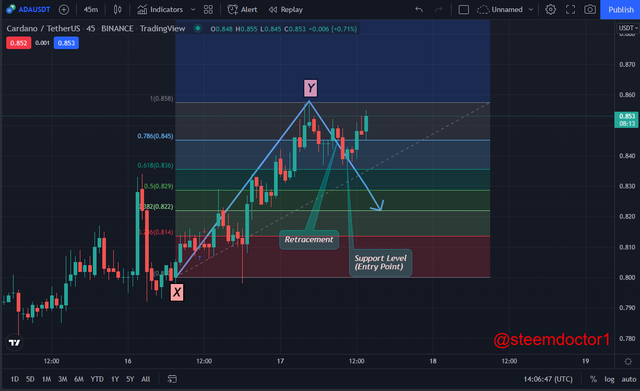
In the above screenshot, we can observe that the Fibonacci Retracement tool is applied on the chart from the previous low point (X) to the recent High point (X). The reversal point of the retracement happened on the 0.618 Level of the Fibonacci Retracement tool which can be seen in the above image. So, this is a good entry position as the price will move upward to create a new high point, as the trend was bullish. The Trade setup for the Buy entry trade can be seen in the below screenshot.
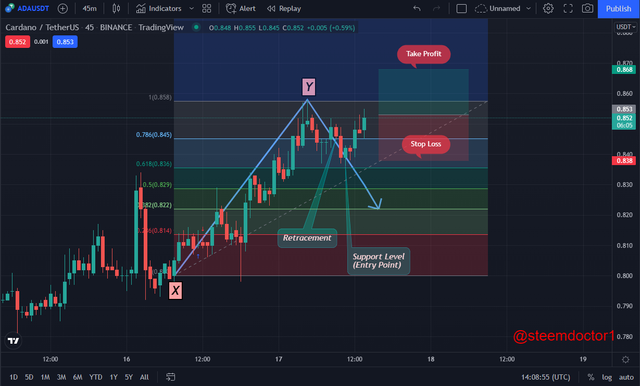
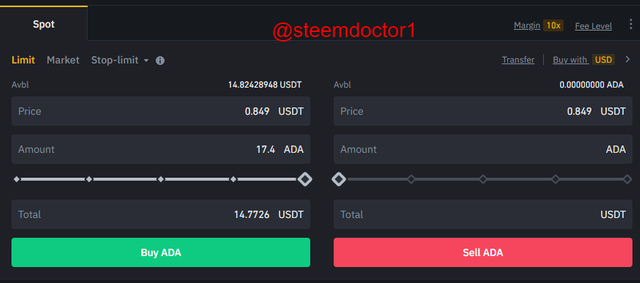
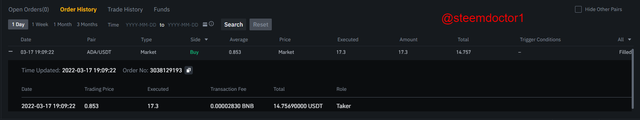
In the above screenshot, we can observe that the Take Profit and Stop Loss points are set at the ratio of 1:1 for the proper risk management for this trade. So, I opened a Buy trade at this point from the Binance exchange. The screenshots for the trade are shown below.
(05)
On a Demo account, make a trade operation using the Fibonacci extension. Screenshots are required.
As we have discussed and explained the Fibonacci Extension tool in the above sections so now I am going to utilize the knowledge that I have gained from this topic. I am going to open a demo trade in the XRP/USDT pair. Let's have a look at the below screenshot.
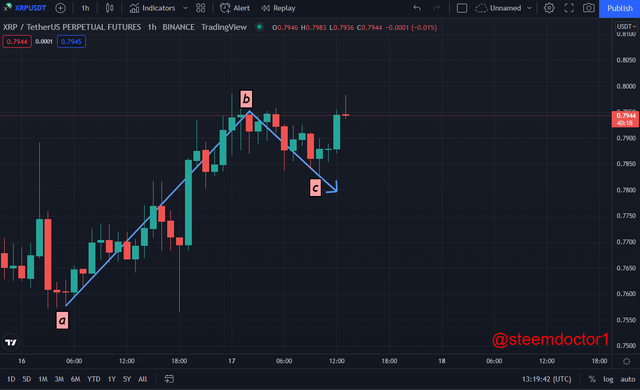
In the above screenshot, we can observe that the market of the XRP/USDT pair was in a bullish trend and there was a retracement in this bullish trend. I have marked the start of the trend (a), the end of the trend (b), and the end of the retracement that is determined by the Fibonacci Retracement tool (c). Now, I am going to apply the Fibonacci Extension tool on the chart. So, have a look at the below screenshot.
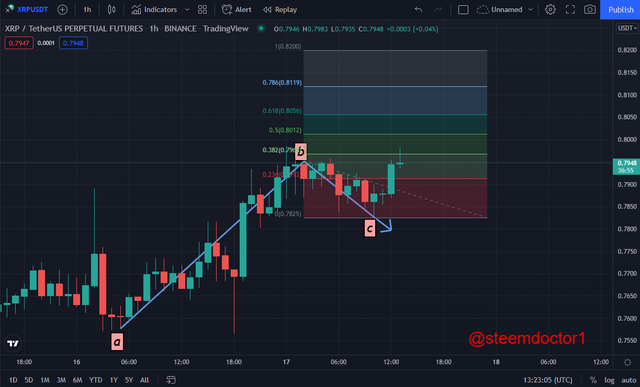
In the above image, we can observe that I have drawn the Fibonacci Extension tool from point a to b, and then from point b to point c. The retracement ends at point c and this point became a good entry position (support) for the Long Trade. Have a look at the below image to see the trade setup that I have executed in the market.
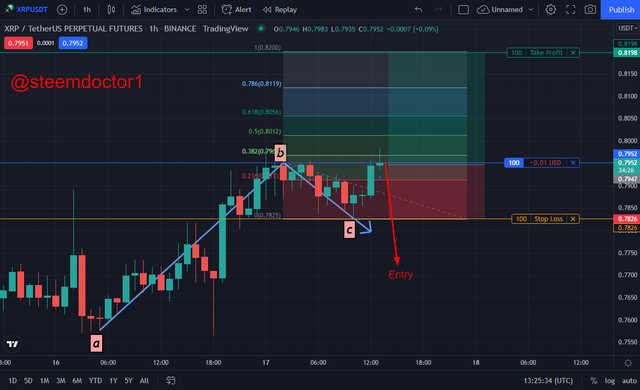
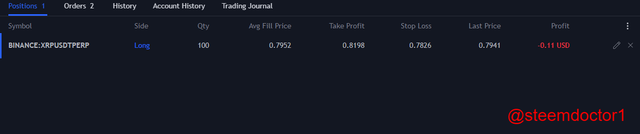
In the above image, we can see that I have placed the Take Profit level at the Fibonacci Level 1 ($0.8198) as the price is likely to reach this level before another retracement. I have also placed the Stop Loss level just equal to the 0 Level of the Fibonacci Extension Tool to avoid the loss if the price makes an unpredictable move. The proof of the trade that I have executed in the market can be seen from the below screenshot.
Conclusions
Fibonacci Retracement tool is a technical analysis tool that can be used to determine the price reversal point after the retracement during a particular trend. The reversal points that are obtained from the Fibonacci Retracement tool are of unique significance for the traders as they can make entries at those points and the counter-traders can set their Take Profit levels accordingly.
Fibonacci Extension is a technical analysis tool that is helpful to determine how far the price will follow the original trend after the retracements points. By using this tool, the traders can come to know how much distance will be covered by the price after the retracement reversal. So, this is also a very useful and beneficial analysis tool that can especially be used for marking the Take Profit points.
So, that's all about the homework for this week. Hopefully, all of you will like this post. Special thanks to dear professor @pelon53 for such an amazing lecture.
Note: All the screenshots are obtained from the TradingView platform.
Writer: @steemdoctor1 (Crypto Student)

