Steemit Crypto Academy- Season 4 Week 2- Homework Post For @reminiscence01
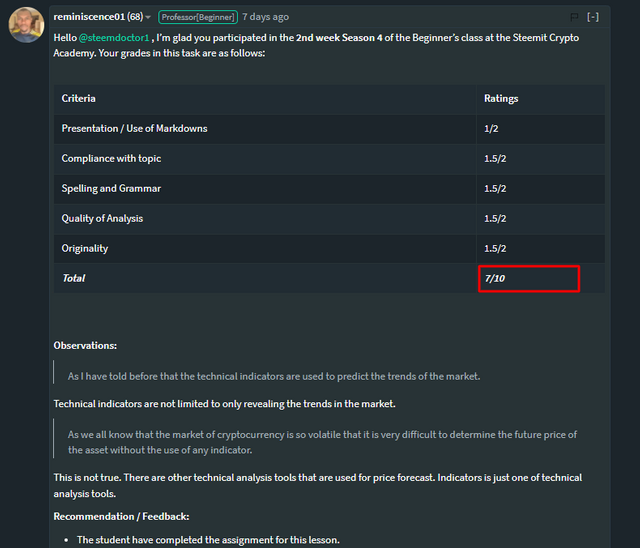
Hi, this is the screenshot of the previous mark distribution. And now I am reposting my content as it was not curated.
Hello everyone.
Hopefully, all of you will be happy and enjoying your precious health with the grace of Almighty Allah. Today I am here to present the homework for dear professor @reminiscence01 in Season 4 of Steemit Crypto Academy. The explanations that are given by the professor are very much informative and useful.
I have read the whole of the lecture post and I have understood all the concepts he has explained in the lecture. So, let's start our task without any wastage of time.

There are some questions that are asked by the professor as the assignment of this week and I will discuss the possible answers and explanations to these questions according to my knowledge in the given order.
Question : 01
(a)
In your own words, explain Technical indicators and why it is a good technical analysis tool
Technical Indicators
As we all know that the market of cryptocurrency is so volatile that it is very difficult for new traders to indicate the trends and conditions of the market. They need something helpful or useful to determine the trends of the market in with they are going to invest their money. So, the Technical Indicators are proved to be helping them for the prediction of future market trends.
Technical Indicators are the tools in the crypto market chart analysis that are used for the technical analysis of the chart. They are used to predict whether the market is in a bullish or bearish trend, or a ranging market, etc. The indication of the market trend by the technical indicators is based on the history of the flow of the market and movement of the lines in a graph of a market.
The technical indicators are used to indicate the previous areas of the graph of an asset. They show the previous higher and lower touches of the prices of the assets. These indicators indicated the high and low points of the charts keeping in view the previous data of the flow of the price. So, with the help of the technical indicators, the traders can make good decisions in a market. Technical indicators are also used along with other indicators to verify them.

(b)
Are technical indicators good for cryptocurrency analysis? Explain your answer.
As I have told before that the technical indicators are used to predict the trends of the market. So, this thing is very useful in cryptocurrencies due to the volatility of the crypto markets. The market of cryptocurrencies is so volatile that it is very difficult to predict the future price of an asset without the use of any indicator.
So, the use of the indicators in the cryptocurrencies markets affects the trading positively. Technical Indicators are very useful tools in predicting the flow of the values of cryptocurrencies.
Technical indicators show that either the market is trending or ranging, it is following the upward trend or the downward trend. So this thing helps the users to predict the behavior of the volatile crypto market and one can make better decisions and earn better profit from the fluctuations.
In short, the technical indicators are very useful in cryptocurrency trading because they allow the traders to predict the future value of the currency by keeping in view the historical price and volume of the asset.
(c)
Illustrate how to add indicators on the chart and also how to configure them. (Screenshot needed).
As we have discussed the details about technical indicators in the above sections. So, now I am going to show the method to add indicators on a chart and configure these indicators. So, Let's follow these steps.
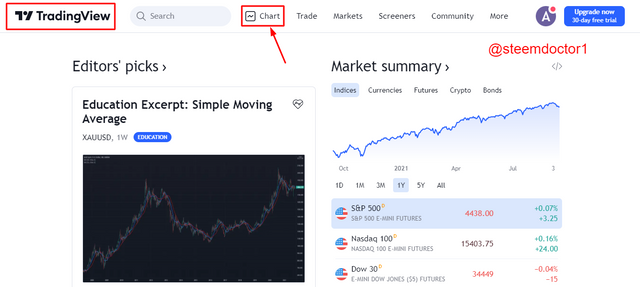
- First of all, go to the browser, open the https://www.tradingview.com/ site. Click on the Charts option in the top bar as shown in the below screenshot.
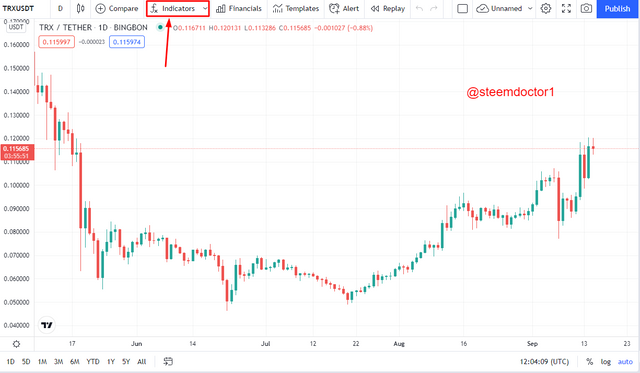
- A Chart of crypto pairs will open(TRX/USDT in my case). Click on the fx Indicators option, located at the top.
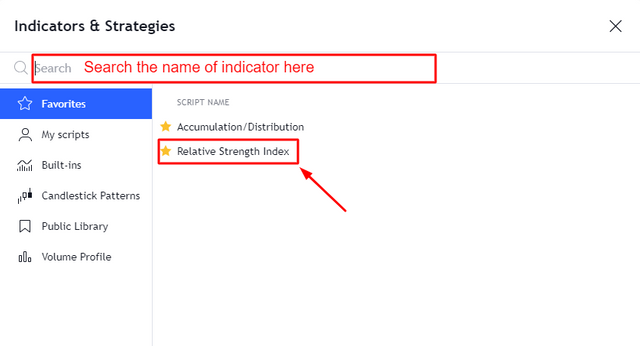
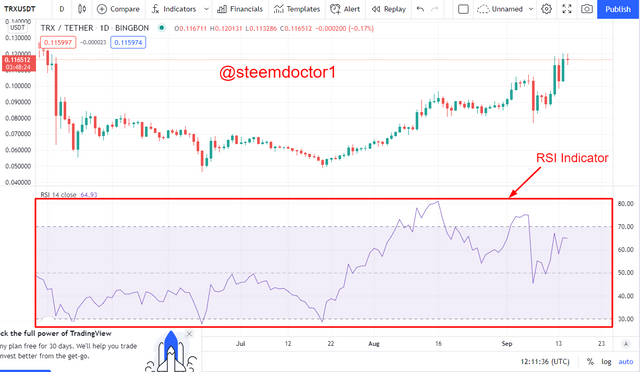
- A menu will appear and you have to search the desired indicator name in the search bar. I am going to add the RSI(Relative Strength Indicator), as shown below.
- The indicator will be added to the chart, as shown in the below screenshot.
Configuration of the Indicator:-
Now, I am going to configure the RSI indicator which I have just added to the chart. To do this, you have to follow the following steps.
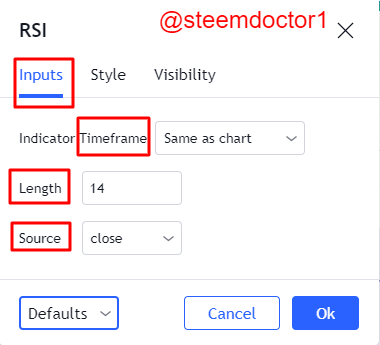
- Double Click on the indicator you have added and a dialog box will appear. As shown below.
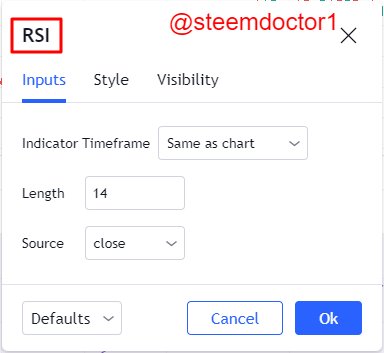
- In the Input section, you can configure the Timeframe, Length, and Source of the indicator.
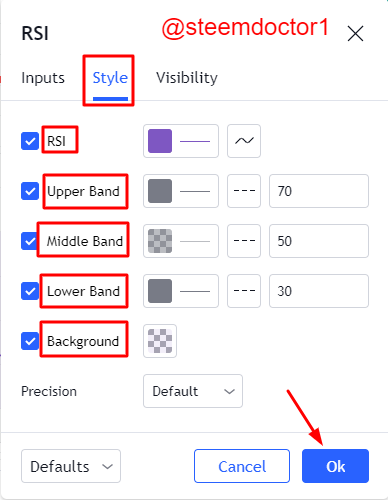
- In the Style section, you can adjust the RSI, Bands(Upper, Middle, Lower), and Background of the indicator.
- And in the Visibility section, you can adjust the Seconds, Minutes, Hours, Days, Weeks, Months, and Ranges of the RSI indicator.
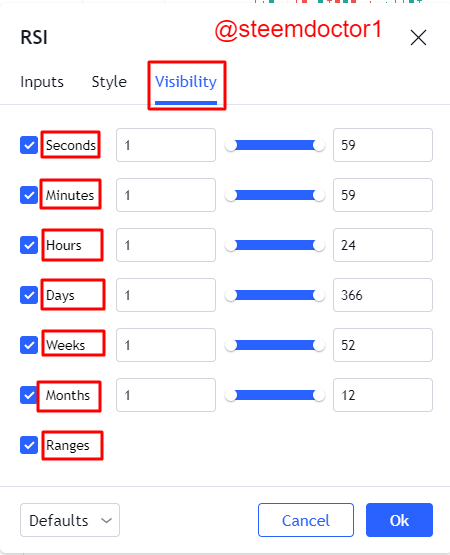
So, this is the method to Configure the indicator.
Note: All the screenshots are taken from TradingView
Question : 02
(a)
Explain the different categories of Technical indicators and give an example of each category. Also, show the indicators used as an example on your chart. (Screenshot needed).
On the basis of their work, the technical indicators are divided into three basics types. One can use these indicators to avoid losses from the volatility of the crypto markets. So, Let's discuss these types briefly.
Trend Indicators, as referred to by the name, are those indicators that show the trend of the market. These indicators help the traders to determine or predict the trend of a particular crypto market. As these indicators determine the trends of the market so they can be used to determine that either a market is in a trending position or in a ranging position, the market is an upward or downward trend, etc.
These indicators also predict the current position of the market (trending or ranging) so the traders can make good decisions by using these indicators.
=> Example:-
- Average Directional Index ( ADX)
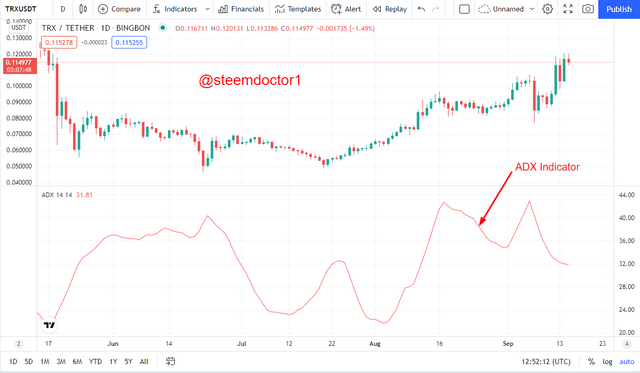
As we all know that the market of cryptocurrency is so volatile that it is very difficult to determine the future price of the asset without the use of any indicator. So the technical indicators that are used to determine the volatility of the market of cryptocurrency are called Volatility Based Indicators.
Volatility Based Indicators show the volatility of the market and help the users to get better profit by predicting and buy and sell points in a flowing market. So, the users can get good profit by tackle these fluctuations in the market by utilizing these indicators.
=> Example:-
- Average True Range (ATR)
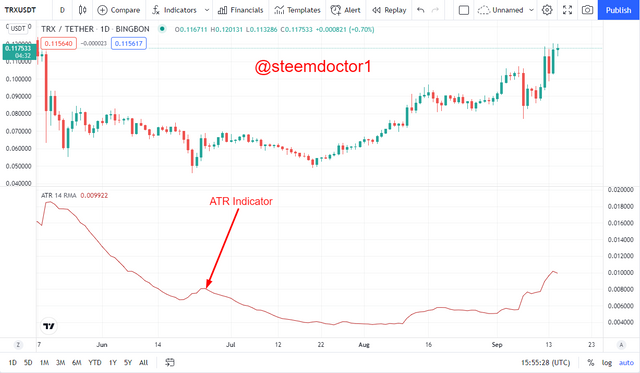
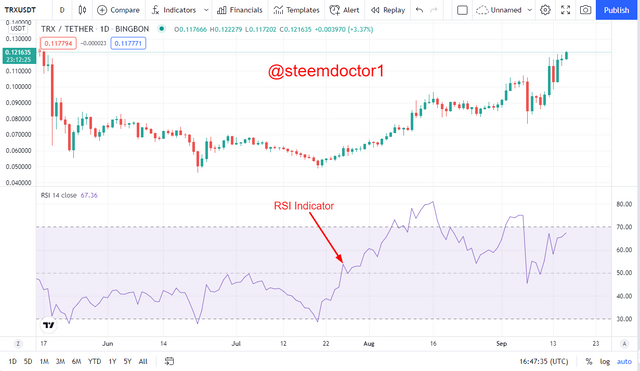
Due to the volatility of the market, the price of the assets does not remain same for a long time. The value of an asset in the market always remains in continuous fluctuations. So, the high and the low possible prices of an asset are determined by the Momentum Based Indicators. An Upward trend never remains in the upward direction. The whales of the market start extract out their profits and the price of the assets follow the downtrend.
The Momentum Based Indicators represent the oversold and overbought and thus provide the entry and exit points to the traders in the market so that they can get better profit.
=> Example:-
- Relative Strength Index
So, these are some types of indicators that are used in the technical analysis of the cryptocurrency market charts.
(b)
Briefly explain the reason why indicators are not advisable to be used as a standalone tool for technical analysis.
It is a natural fact that nothing is perfect in this universe. Everything pictures have two sides. So, exact same is the case with the technical indicators. Technical Indicators are not 100% accurate and perfect. Fluctuations and changes can be possible in their prediction, most times.
There are several technical indicators that work on different strategies so their combined effect could be proved greatly profitable for the traders. When a trader trusts a single indicator and does not verify the prediction that is made by this indicator then there could be very chances of modifications in these predictions.
So, it is advisable to use more than one indicator to verify the predictions and forecasts of an indicator. These indicators are used as confirmations of the signal of the main indicator.
(c)
c) Explain how an investor can increase the success rate of a technical indicator signal.
The success rate of different technical indicators varies greatly for different trading strategies. Thus, there are many factors that can affect the success rate of a technical indicator. Some of them are as follows.
First and the main factor that affects the success rate of technical indicators is timing. Timing is the thing that must be adjusted for the proper working of an indicator. Suppose, a technical indicator can work properly in a 15-minutes chart then it cannot be applied on a daily chart.
Another important factor in this regard is a complete understanding of the indicator. This understanding may include the application of the indicator, the method to apply the indicator, the correct configuration of the indicator, etc.
One thing that is the most important one is the practice or experience of the trader. An experienced trader or investor can make better decisions by using the indicators correctly and timely. So, they can avoid losses than those of the newcomers.
For the better performance of an indicator, the condition of the market must also be considered. For applying the useful indicators properly and correctly, it is compulsory to know whether the market is trending or ranging or in a bullish or bearish trend.
So, these are some factors that can increase the success rate of an indicator, if applied properly and in a timely.
Final Words
Technical indicators are very useful and strong tools that are used for the better technical analysis of a crypto market chart. These indicators are proved to be helpful for the traders to get better profit and gain a good advantage from the volatility of the market.
There are several kinds of indicators based upon the working of these indicators. Applying more than one indicator on a chart could be helpful for the investors to predict the next flow of the market. And in this way, one can make good decisions and earn better.
Writer: @steemdoctor1 (Crypto Student)

Hello, professor @reminiscence01 please have a look.
Ok. Noted.
Hello, professor @reminiscence01 please have a look.