Daily Crypto Charts! June 20, 2018 (EOS, ETH, BTC, STEEM)

Follow me @steemcharts for daily updates on Steem prices, Bitcoin Prices, Steem statistics and Technical analysis.
Please leave a comment and an upvote as well! Also, let me know if you have any wishes for charts that I should do.
Disclaimer: This is not investing advice. These charts are for fun and beginners. An easy to understand basic introduction to charts.
BTC
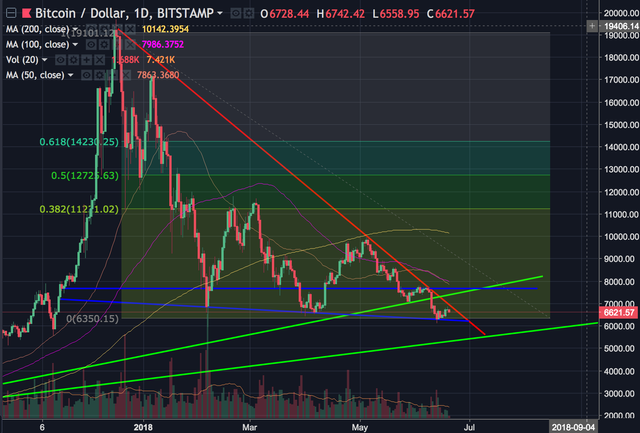
Bitcoin and cryptos did a little jump up yesterday but today we had Bithumb news that it was hacked for $30 mill. They were however quick to notice they will be refunding all funds. Also Tron launch is causing some FUD. However, technically we should see some more action today or tomorrow as we are once again getting closer to that bearish trendline. We are way below all technical indicators such as RSI, moving averages and fib retracement. And if we do see more bearish movements we will continue to fall towards that $5300 area before hitting some sort of support. But we are pretty much in uncharted territory here. Fundamentals is what is most important at this moment.
STEEM
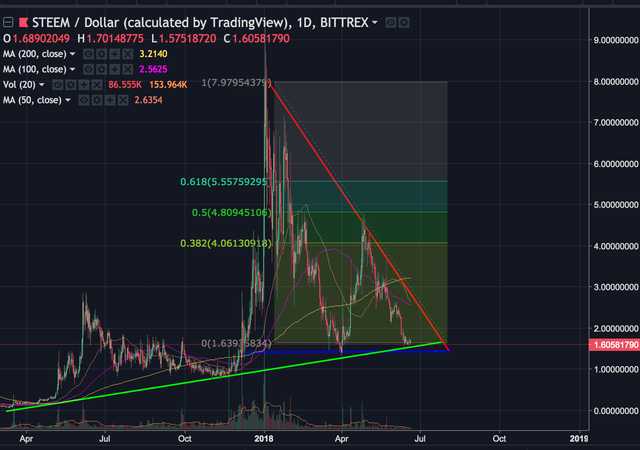
Zooming a bit out on the Steem chart, because I think it's interesting. We have a typical descending triangle that has formed which is very bearish. But right now we are not only hitting a support level, but also a very long term bullish trendline. This means that we are in an area with a lot of support. However, this will not make any difference at this point of Bitcoin and cryptos in general continues to fall. Steem though, is extremly undervalued, and any investment under $2 is IMO a good one long term. However, at this point I would be cautious because if the market continues to stay bearish we could unfortunately see Steem at MUCH lower prices. Again, a little over a year ago Steem was trading at 0,1$.
ETH
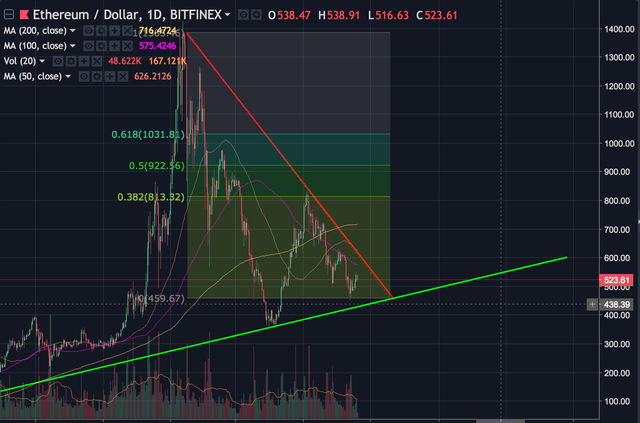
ETH is looking better than Bitcoin and has held better through this last bearish trend. Good support on the long term bullish trendline.
 ,
EOS
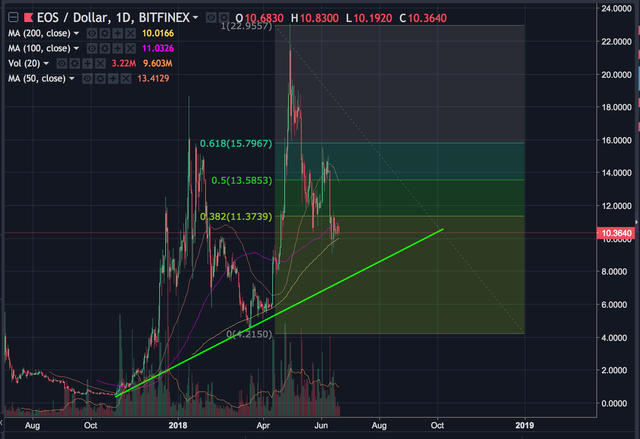
Zoomed out to let you see the long term. Higher highs and higher lows. EOS is looking very good despite all the FUD. And unless something fundamentally is wrong with EOS and fear and panic starts to spread I see this as a very bullish protocol in the future. Imagine the airdrops...
Follow me @steemcharts for daily updates on Steem prices, Bitcoin Prices, Steem statistics and Technical analysis.
Please leave a comment and an upvote as well! Also, let me know if you have any wishes for charts that I should do.
Disclaimer: This is not investing advice. These charts are for fun and beginners. An easy to understand basic introduction to charts.

Thanks for analysis!
This post received upvote from @tipU :) | For vote buyers | For investors.