STEEMCharts - Dan and EOS
Today I released steamcharts.io, a simple tool to visualize data for any steemit author or category. I've had some fun messing around with it, and wanted to share some of the interesting charts I found.
1. Being Dan Must Be Nice
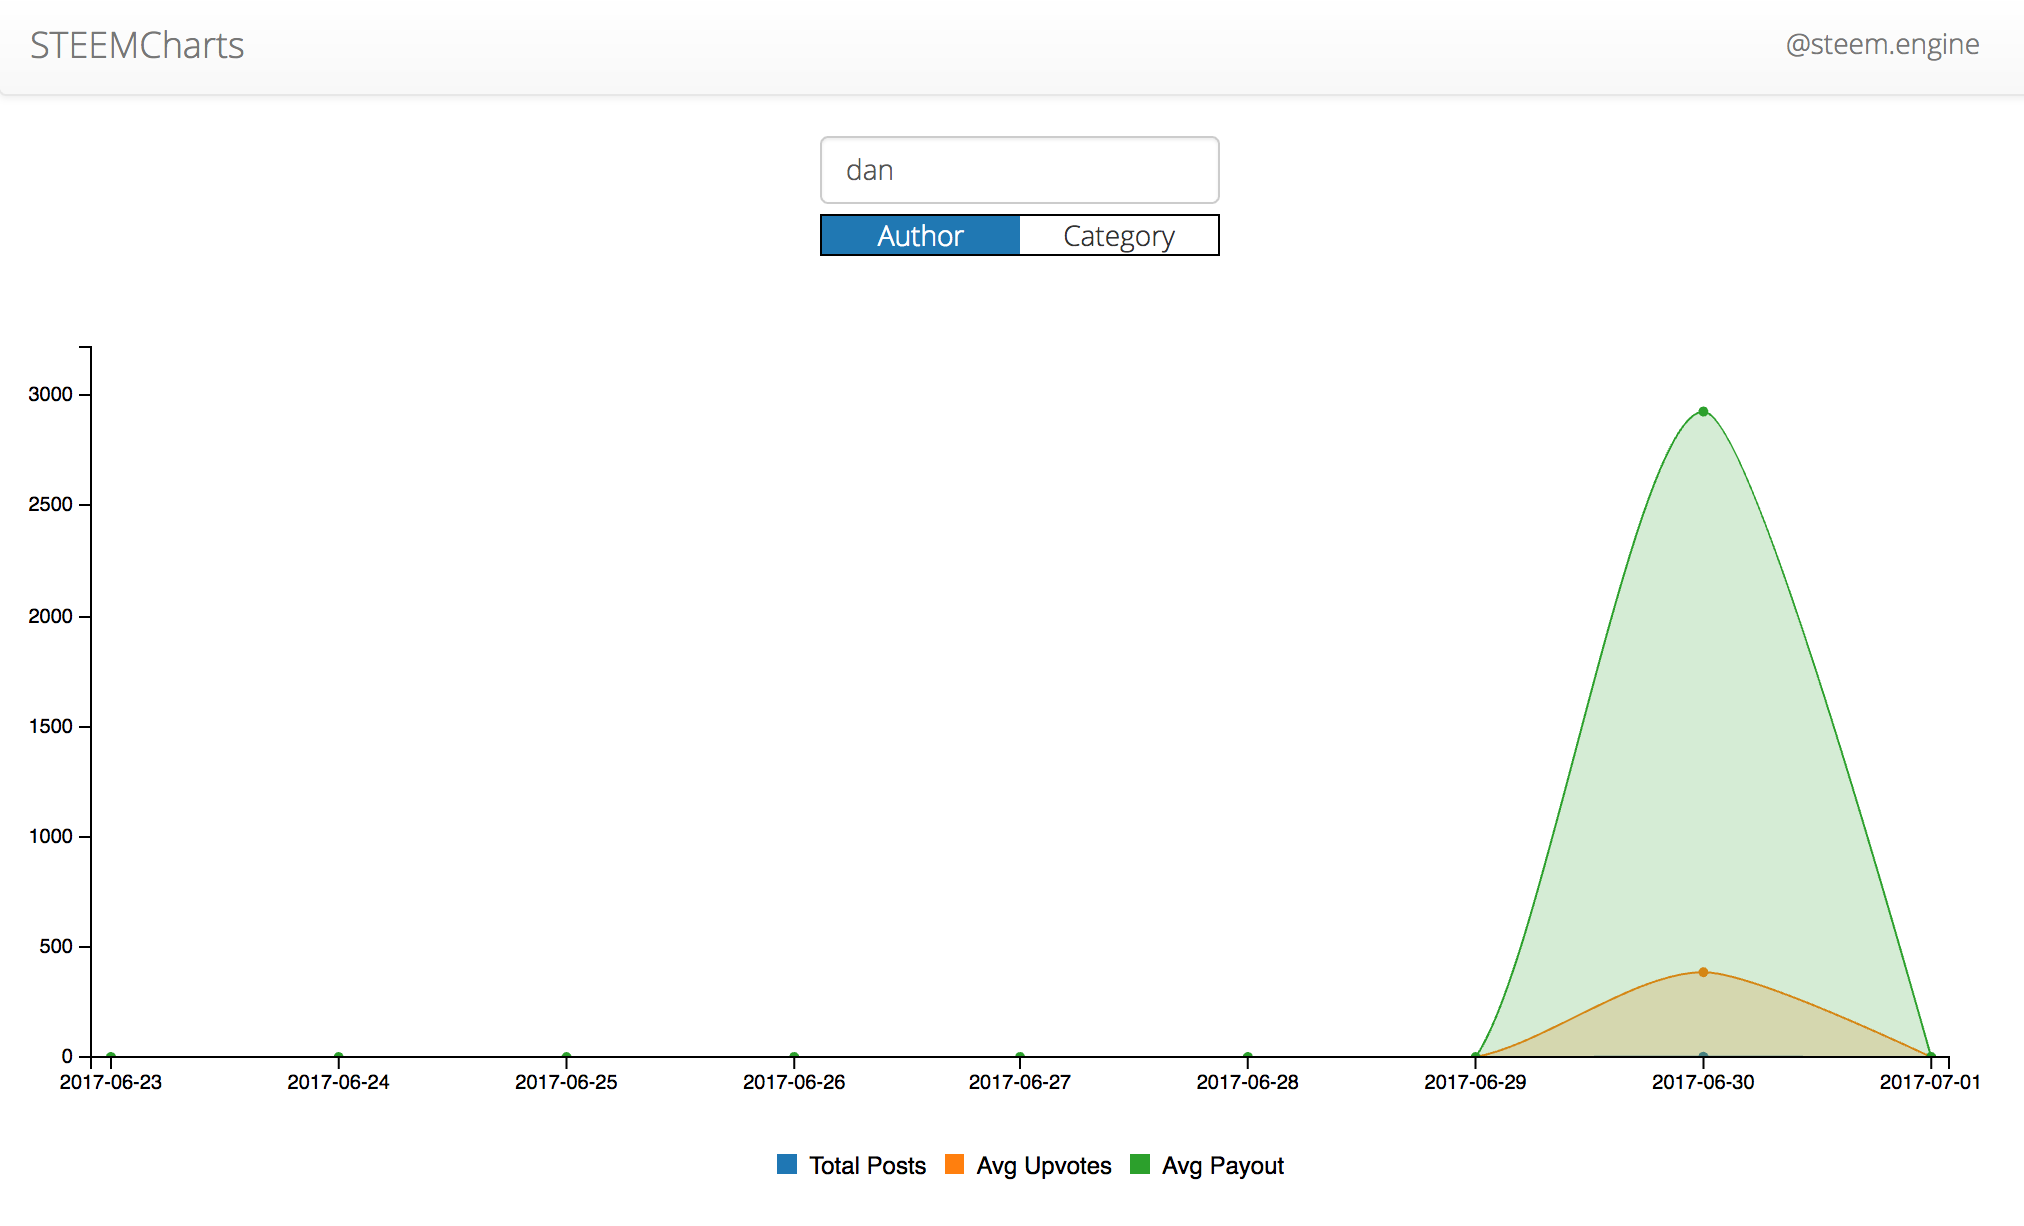
@dan has made one post in the last week, and earned almost $3,000. He's earned every penny. But damn. (update: He is declining payout, so it all goes back into the Steemit community. Pretty awesome)
2. The 'CN' Category Has Ridiculously High Payouts

I pointed this out in a previous post, but it's nice to be able to put a visual to it. 'CN' is the tag for Chinese posts on Steemit. Over the past week, they've been averaging about $80 per post. That's insane. For reference, the category 'Steemit' has had an average payout around $7. Here is the chart for the 'Steemit' category ...
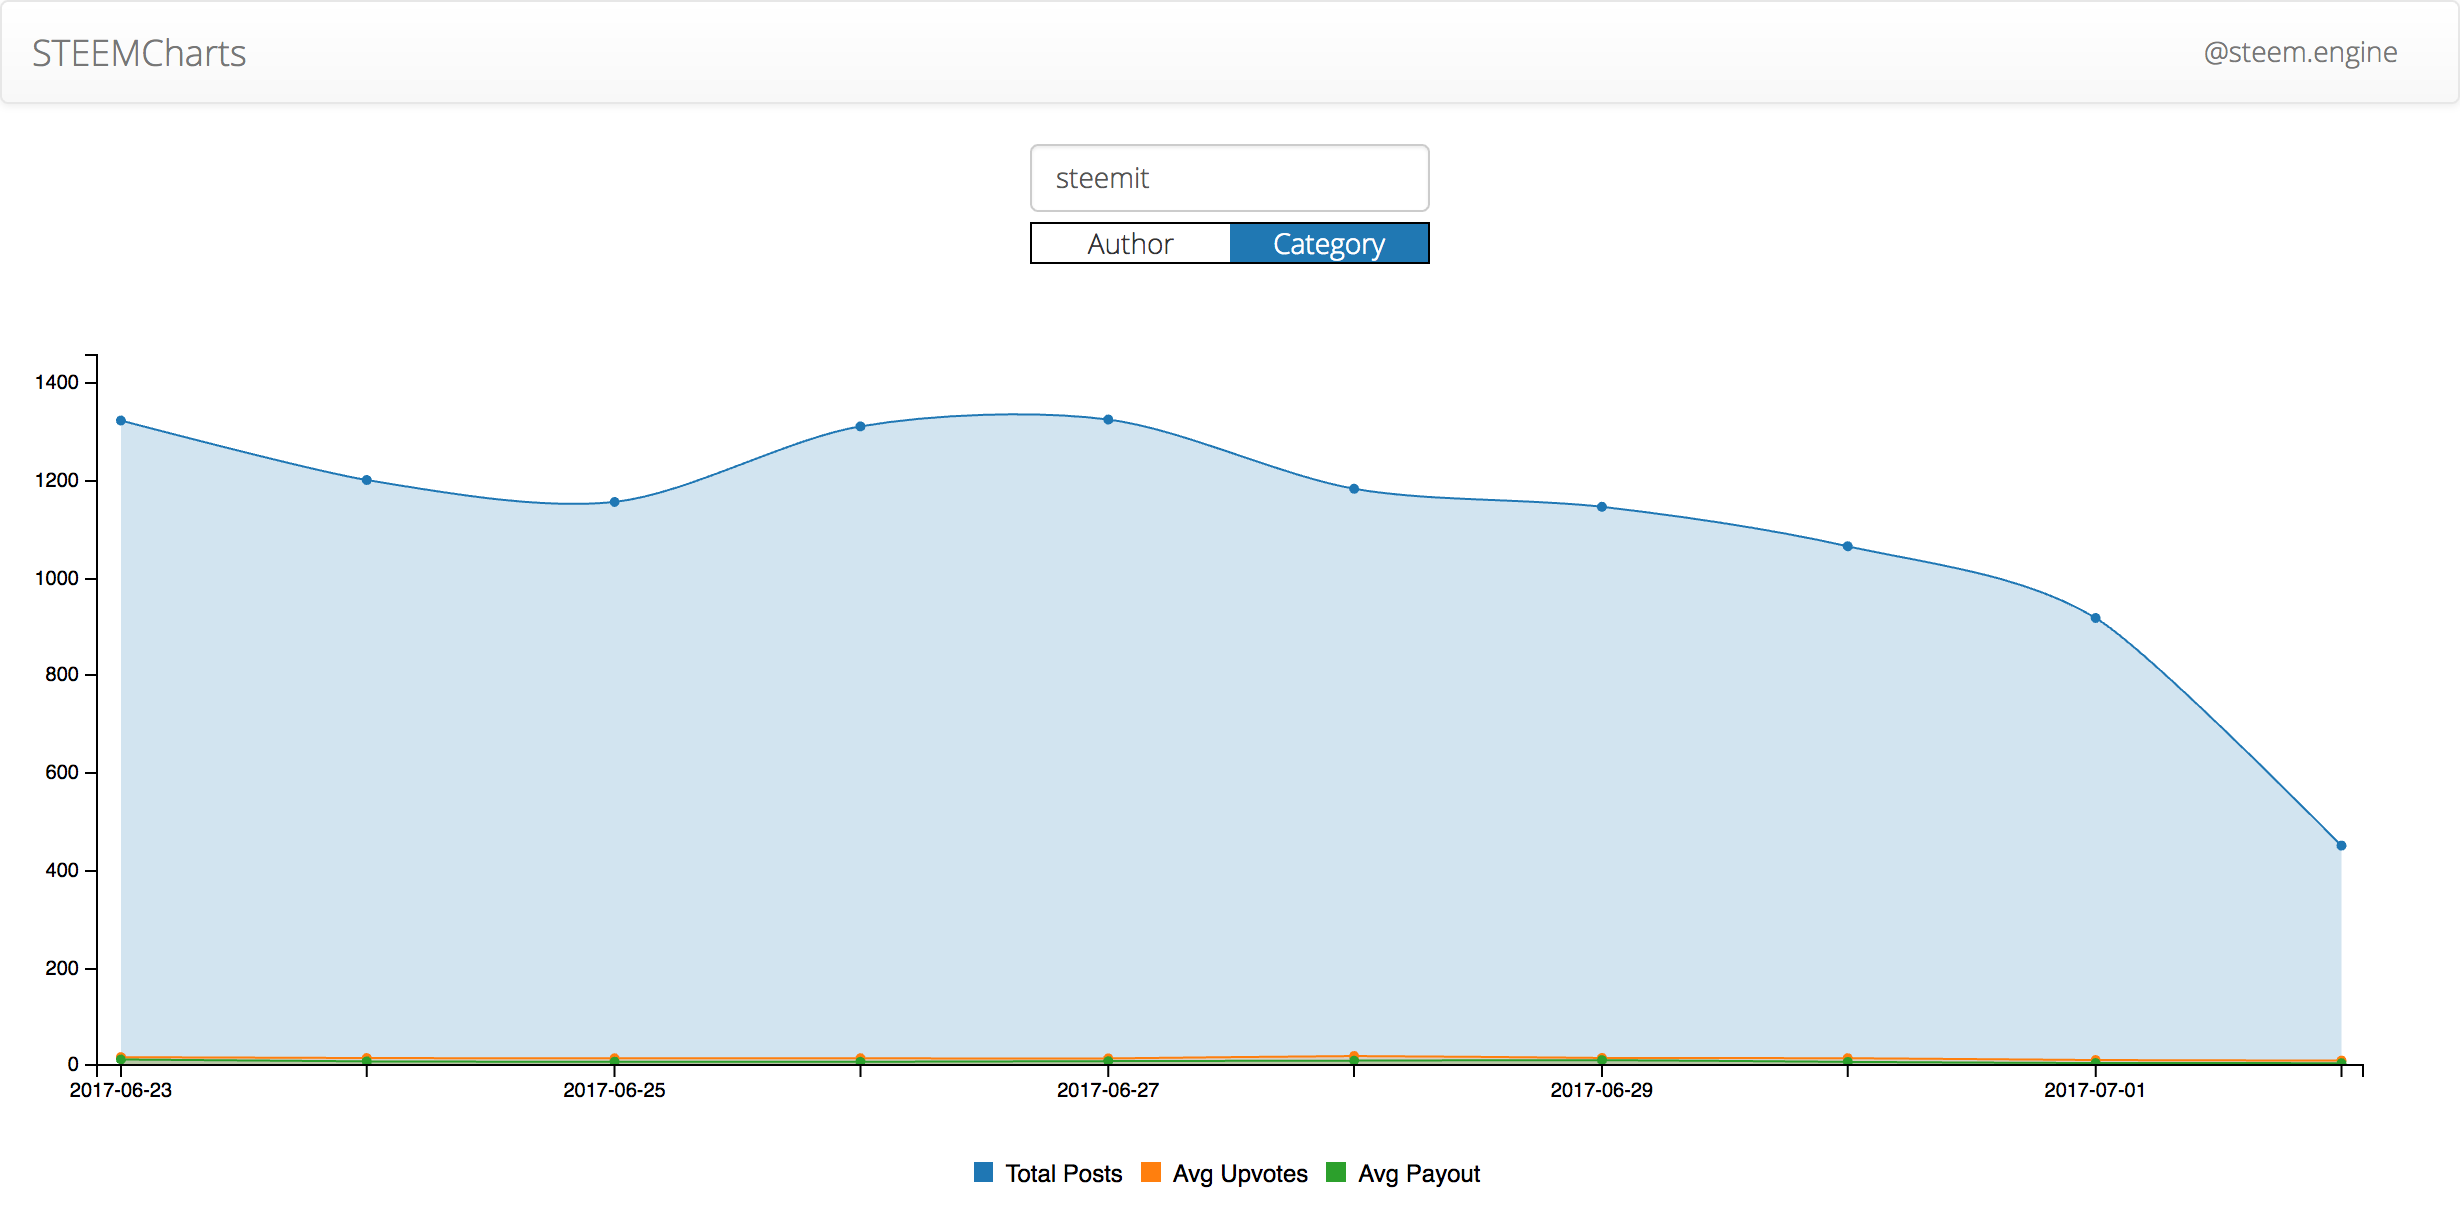
Blue is total posts, orange is avg upvotes, and green is avg payout. You can barely see the green.
3. EOS Is All Over The Place

Other than one spike, the posts per day has been pretty consistent. The payout and upvotes have been all over the place, however. This is likely due to a few very high powered users, who are legitimately involved in EOS, occasionally dropping EOS updates. These have been getting incredibly high payouts.
Ok, that's all for today! If you enjoy messing around with it, please give an upvote, resteem, and follow. Thanks for reading!
@dan's post is way over my head - and the fact that over 450 people upvoted it shows there are sooo many way smarter then i am.
Also noteworthy, @dan declined payout (posts can easily be accessed below the chart), thus giving back to the community. WOW!
The fact that both, category and account can be researched make it so valuable. Analyse Demand and Supply of information - geo-centric data and get a view of user sentiment on Steemit.
Stemcharts.io: Added to MVT (most valuable tool). Thanks!
Happy Sunday.
😎
Thanks for the great feedback! And i totally overlooked the fact that @dan declined payout. That's pretty amazing. Happy Sunday to you too!
Thank YOU! It's value creators like you who make Steemit special
Already a Feature Request
Would it be possible to add multiple uses or categories and to define a date range?
Another Tool?
I also thought it may be useful to have a tool that analyses views and upvotes in terms of weekdays and times... Thinking out loud here...
Steemit Mystery of the day ❓
The other question i have, just for you is this: I notice @steem.engine added as a new follower frequently to my channel - and don't understand how or why?
😎
Hi @steem.engine can you use utf8? Because i see � instead special chars like è. Thanks and good job!
Yep! Was noticing that as well. Will push up a fix for that. Thanks for the feedback
Muy buen trabajo felicidades
Great job @steem.engine, thank you!
This is really cool - thanks!
Thanks! I'll be looking to add more functionality to this tool daily
Fantastic tool...time to bookmark and not get any sleep. Here comes the Monster Drinks...
Haha thanks. Don't go too hard on the energy drinks
I usually cut myself off around 4 cans. Servings are just suggestions right?
That is great. I could play with those graphs for ages :) I appreciate your effort. Thanks.
Glad you enjoyed it :)
cool stuff @steem.engine :)
Great, very useful!
very useful charts. great work