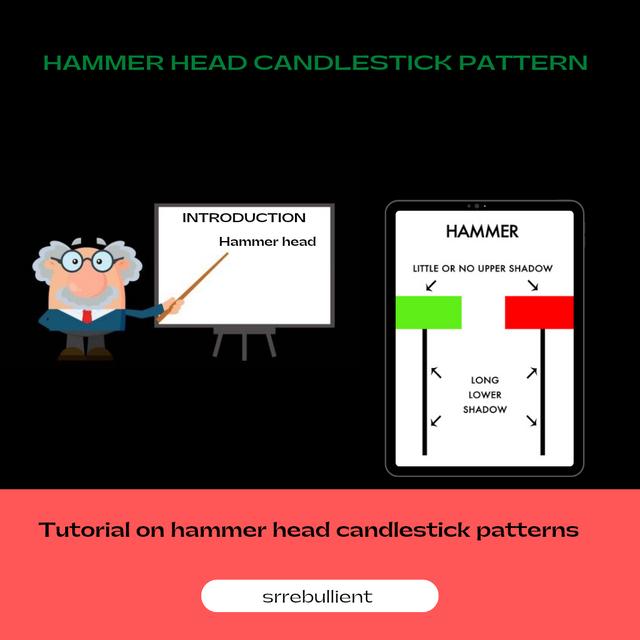
TUTORIAL ON HOW TO HAMMER HEAD CANDLESTICK PATTERN-10% TO @TRON-FAN-CLUB
Hey guys,
Welcome to my blog.
The financial market has been a major talk since this year due to the general downturn it has been experiencing. Most recently, the talk has increased especially on the side of cryptocurrency market due to the rapid dump of Bitcoin price which led to the general dump in the prices of altcoins including STEEM.
In as much as we are currently experiencing hard times due to the downturn, traders and still constantly trading the bear market. Trading the bear market appears to be more risky thus requires more decipline and extra knowledge especially on technical analysis. For that reason, I have decided to come up with this lesson where we will be looking at "How to trade with hammer head candlestick".
- Candlestick pattern
Before we proceed, let's briefly look at the candlestick pattern to in other to fully grasp what we will be dealing with.
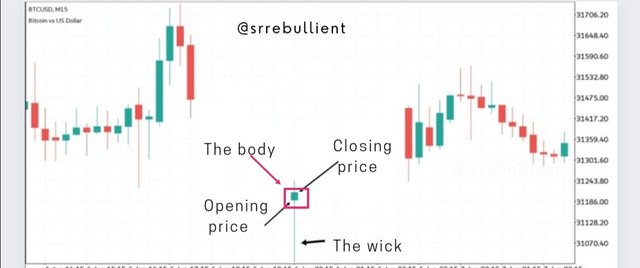
Each candle in a candlestick chart corresponds to one period, depending on the timescale you choose. Every candle on a daily chart indicates one day of trading activity. Every candle on a 4-hour chart indicates 4 hours of activity.
Each candle body is made up of the open and closing prices for each candlestick. They also include a wick (or shadow) that represents the highest and lowest prices throughout that time period.
The hammer candlestick is a versatile design that may be used in a variety of markets. When looking at price movement, it is one of the most common candlestick patterns traders employ to judge the likelihood of outcomes.
- Hammer candlestick pattern
When a candle has a short body and a long lower wick, it is called a hammer candlestick. The wick (or shadow) should be at least twice as big as the body of the candle. The price was driven down by sellers before being pushed back up by purchasers above the open price, as seen by the extended lower shadow.

The hammer head candlestick are categorized into bullish and bearish hammer head patterns and we will be looking at them with examples.
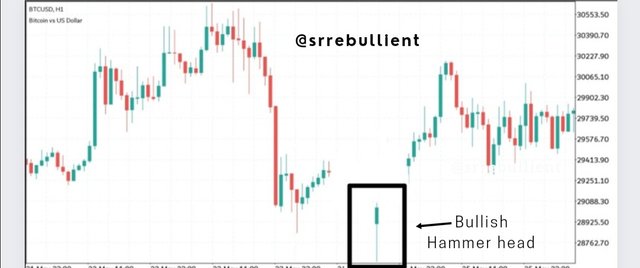
- Regular bullish hammer
A regular bullish hammer head is formed when the price closes above the opening at a particular timeframe. Still indicates that the buyers were able to take control of the market during that particular period of trading.
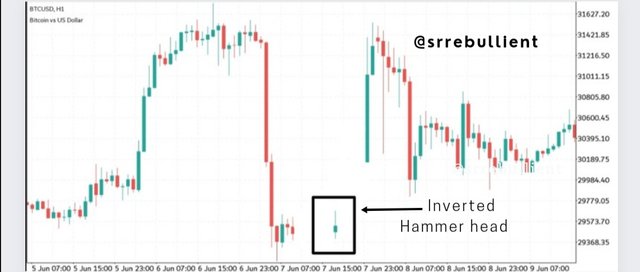
- Inverter bullish hammer
The inverted bullish hammer is formed after a price has been pull down and still manages to close above the opening thus forming a long wick above the body of the candle. This shows that sellers wanted to pull the price down but the strength of the buyers is became strong enough to hold the price from closing below the opening at that particular trading period.
In as much as this inverted bullish hammer serves to provide bullish reversal signal, it is not as bullish as the regular bullish hammer.
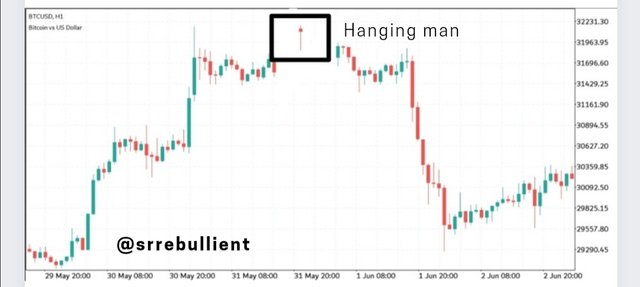
- Hanging man
The hanging man is a bearish reversal candle that is formed when the price closes below the opening price thus resulting in a red candle. This shows that sellers were eager to compete with buyers by pulling the price down and in as much as buyers tried in getting the price up they were unable to overcome sellers due to their inability to get the price to close above its open.
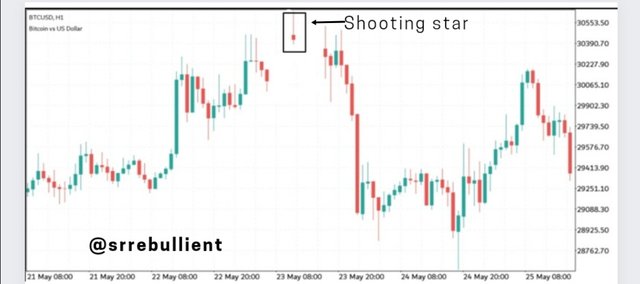
- Shooting star
A shooting star is a bearish reversal candle which is similar to the inverted hammer but different in the sense that the price closes below the open and leaving a wick above the body of the candle. This shows that buyers where eager to take the price up but the strength of sellers was able to pull the price down thus making it close below the opening at that particular trading period.
In as much as the hammer head pattern serves to provide trend reversal signals, it is always best to combine it with other technical analysis tools in other to gain confluence. This will allow a trader to minimize the chances of falling for various market manipulations such as fake reversals and also increase their confidence.
- Bullish signal
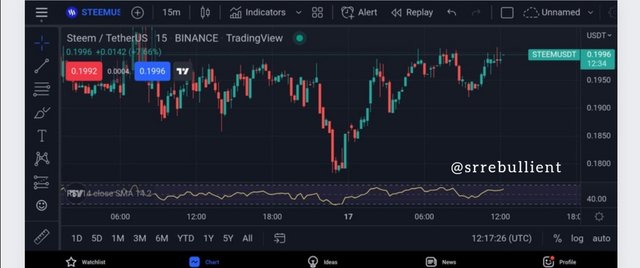
In other to trade using the hammer head, we will be adding an RSI indicator which will serve to provide confluence in other to increase our chances of success.
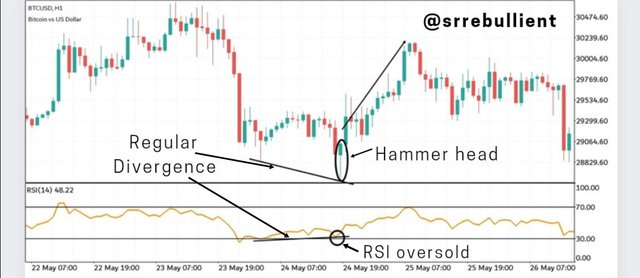
From the above we will see that a regular divergence was supported on the RSI which indicates a loss in bearish momentum. In addition to this, the RSI was also found to be in an oversold region which normally signals a bearish to bullish reversal signal.
The formation of a hammer head serves as a final confirmation to the signal already given by the oversold position of the RSI and the regular divergence spotted between the RSI and the price chart.
- Bearish signal
For a bearish signal, we will have to apply the same RSI indicator in other to find confluence on the chart.
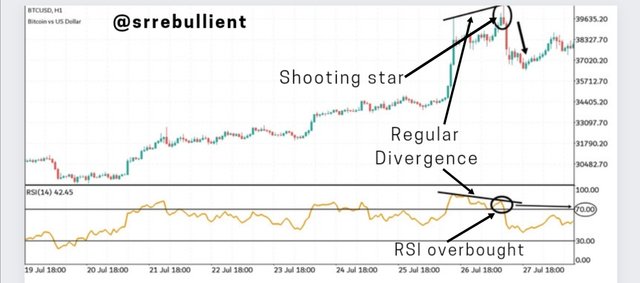
From the above we will see that a divergence was spotted which tells us there's a reduction in bullish momentum thus signaling a possible bullish-to-bearish price reversal.
Also the RSI was found to be in an overbought region which indicates a possible pullback or reversal. The formation of a hanging man candle further confirms the signals already provided by the RSI thus increasing confidence and the possible chance of success.
| Advantages | Disadvantages |
|---|---|
| The hammer head formation is used in spotting out both bearish and bullish trend reversals | The hammer head is not totally efficient as it is likely to give out fake signals. |
| The hammer head can be used on different timeframes | The hammer head is not used independently but is combined with other technical analysis tools in other to increase efficiency. |
| It is useful for both scalpers and swing traders | Traders can easily mistake other candle patterns as the hammer head with an example being doji pattern. |
Trading has grown to become a lifetime career for many which explains why a proper attention should be given in understanding very concept of trading. If you have followed my lesson today on the use of hammer head candle stick pattern I will be left with no doubt that you have most certainly added something beneficial to your knowledge.
Link to tweet
https://twitter.com/EbullientSrr/status/1537837445986799616?s=19
Has made a very nice post about technical analysis. I like the candlestick pattern very much. You arranged all the information in a very neatly arranged manner.
I'm grateful for your appreciation. I had to put in efforts so that those that will go through it will find it easy to understand.
A well informative lesson you have shared with us all. Thank you for all you do.
Thanks bro for your nice comment.
You are welcome my dear friend.
one of the interesting posts and certainly very good to listen to. Thank you for sharing here and of course this will be one of the things that is useful for others
Thank you for contributing to #LearnWithSteem theme. This post has been upvoted by @Reminiscence01 using @steemcurator09 account. We encourage you to keep publishing quality and original content in the Steemit ecosystem to earn support for your content.
Regards,
Team #Sevengers