TRADING USING RSI AND MOVING AVERAGES - 10% to Tron-Fan-Club.
Hello everyone, welcome to my blog.

Today I would like us to look at trading using RSI and Moving averages.
- What is RSI?
The RSI which is the short form for Relative Strength Index is a volatility based indicator which is used in identying when and asset is either overbought or oversold. It has a default line of 70 and 30 which represents the overbought and oversold regions respectively.
It is also a leading indicator because it signals traders on a possible price reversal which helps them to take position in preparation of the price action thereby allow them to make maximum profits.
- Moving averages
Moving averages are trend-based indicators which aids traders in know the apparent trend direction by filtering out minor price fluactions on price chart. It does this by trending either above or below the price chart and when it trends above, it indicates a down trend while trending below indicates an uptrend.
Unlike the RSI, the moving average indicator is a Lagging indicator because it only signals an obvious price action. This makes it more immune to fake reversal thus making it suitable to guide traders away from counter-trading (trading against the trend).
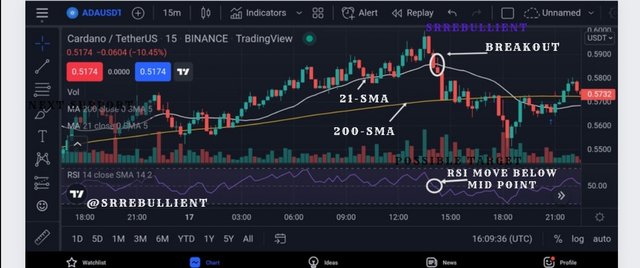
In other to carry out this analysis, I will be adding two smooth moving averages with a period of 21 and 200 respectively. Then, I will add an RSI and leave it on its default settings.
Let's look at our first example on ADA|USDT pair on a 15 mins price chart.
After adding the above mentioned indicators, we will wait for an entry signal by waiting for price to break either above or below the 21-SMA which serves as a dynamic support or resistance to the price.
After the break on the 21-SMA, we will wait for the RSI to move either above or below its mid-point depending on the price direction. This will serve as confluence on the signal provided by the breakout on 21-SMA.
Once the RSI and the breakout are both in agreement, we will make an entry and target the 200-SMA as our exit position because it will now be serving as the next dynamic support or resistance.
- See below
Look at another example on BTC|USDT pair.
- See below
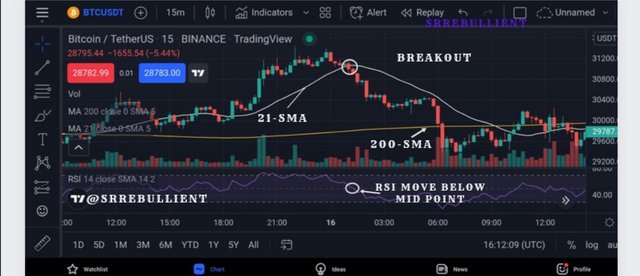
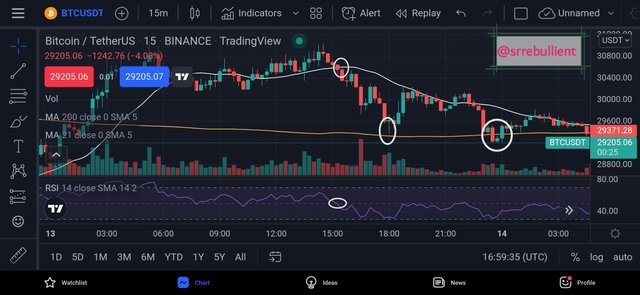
From the above, we will see that the price also broke the 200-SMA despite serving as a dynamic support but regardless, we should always set our target to be on the 200-SMA because price doesn't always break it just as seen below.
- See below
Cryptocurrency trading is one that requires some good knowledge of technical analysis due to is high level of volatility which often makes traders to lose funds.
In as much as it is important to learn some good numbers of trading strategies, I still feel it's best for a trader to maintain one simple strategy in other to master it and become more profitable.
Tweet link
https://twitter.com/EbullientSrr/status/1526982415536766976?s=19
RSI indicator is great if you're trading with technical tools. It will help to known the best time to buy or sell
It's a good read, thank you for coming up with this beautiful post
When I first started to trade RSI was my most users indicator but this days I realised that RSI is greatly flawed and deceptive.
Most times prices remain in the over sold region or over bought region without coming to touch the over bought
I don't know much about trading but from the posts I have read and the assignments I have carried out, it appears that although RSI is one of the most used indicators and can be found in numerous trading platforms and analysis charts but I also heard it has it's flaws and would be advisable to use it with another trusted indicator. Thank you for this amazing post
You're right.
It is always adviced for one to combine indicators in other to find confluence which is what increasing the accuracy of analysis.
Thanks for your comment.
Both RSI and MAs are doing a significant contribution to the Trading field. To filter the trend, and find hidden bearish or bullish divergences, we have to use these indicators. You have nicely explained those indicators in a very clear manner.