Technical Indicators 2. Crypto Academy / S4W4- Homework Post for @reminiscence01".
Thanks so much professor @reminiscence01 this course is educative!
1. Explain Leading and Lagging indicators in detail. Also, give examples of each of them.
b) With relevant screenshots from your chart, give a technical explanation of the market reaction on any of the examples given in question 1a. Do this for both leading and lagging indicators.
Derived from your own explanation
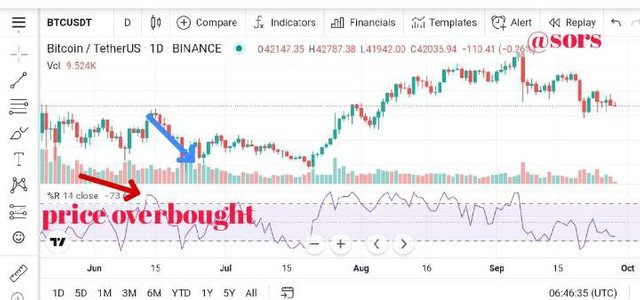
Leading indicator are indicators that permit traders to spot the movements of price in the market before the actual move start. These indicators gives traders quick signals to enter the market on time, capturing the entire trend and minimizing the size of their stop losses
leading indicators help traders prelude price movements before they occur by pointing out the overbought and oversold regions of price. Traders would know when the price is at this region, we expect reversal and formation of a new trend to happen. But have it in mind that in a strong trending market, price can remain in the oversold and overbought regions for a long time before reversal occur.
leading indicators are close to price manipulation and fakeouts. trader can be mislead by to jumping into false breakout or fake reversal that may just be a retracement of price to go on with its original trend. The best way you can use the leading indicators is in a sideways market but have it in mind that the setbacks is associated with using them and back them up then with other technical analysis tools.
my own research
Leading indicators gives sign for potential upcoming changes in trends, in business conditions, and the economy. Politicians, lobbyists and other economic experts use leading indicator's forecasts and predictions to a wiser financial decisions.
Leading indicators give traders chances to control the price movement future since they think forward ➡ and insights in predictions.
Leading indicator was first used in economics. The aim was to determine measurable indicators that if monitored, it could predict the ups and downs of the economy in the future. If the default mortgage number start to increase that is a warning signal that the economy might also go into negative changes. Same things goes with trading, it spot the movement of the market before it start moving which notify traders what is possible to happen.
Extension tools and Fibonacci retracements are examples leading indicators because they forecast where the price may move next before it occurs
From your explanation
Lagging indicators
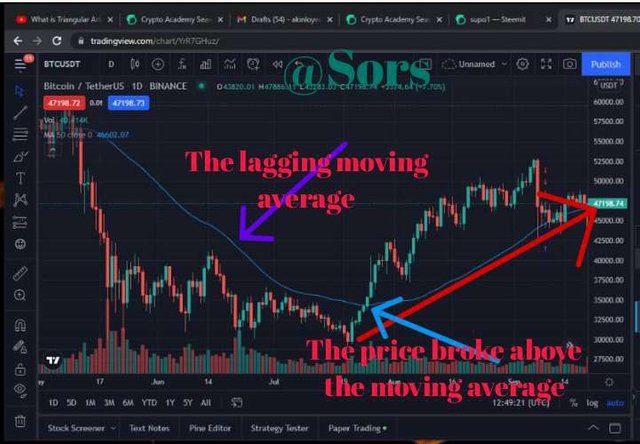
Lagging indicators inform the traders about the start of a trend after the trend has already begin. They lag at the back of the price and they are fit for long-term trends. They are not nuel to price manipulation or fakeouts as they confirm that the trend has already begin before they give out signal.
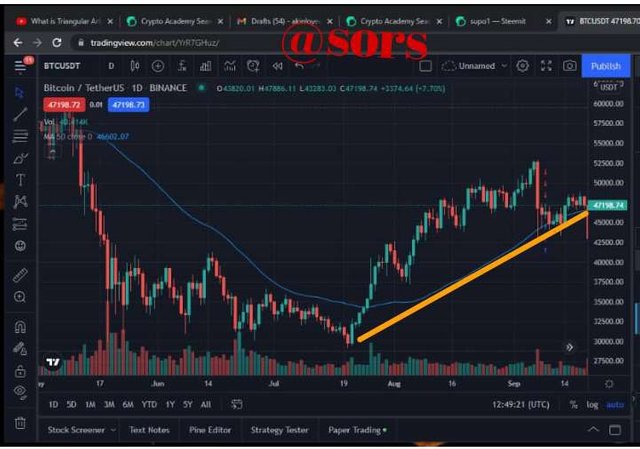
Lagging indicators also have their own disadvantage in the sense that, they makes a trader start tradrading when the trend has already begin which leads to missing out on the necessary market moves and also have a wide stop-loss. Using lagging indicator might make trader enter the market when the trend has already weak and it might reverse on you. Where lagging indicators are useful best is in long term trending market as a confirmirmation tool for a strong trending market.
screenshot from TradingView &edited with PicArt by me
My research
Almost all of the technical indicators lags because they look at historical data only and they are not don't predict or show the direction that the price is likely to go next. Nevertheless, lagging indicators is able to lead price in some ways like divergence
A lagging indicator behind the price and it gives delayed response to the trader.
A moving average is good example of a lagging indicator. If the price is come down and then goes back up, the moving average may keep going higher after the price has reacted. Other examples of the lagging indicators are MACD, Parabolic SAR, etc.
2. What are the factors to consider when using an indicator?
b) Explain confluence in cryptocurrency trading. Pick a cryptocurrency pair of your choice and analyze the crypto pair using a confluence of any technical indicator and other technical analysis tools. (Screenshot of your chart is required ).
Your explanation
- Understanding your Trading Strategy
- Understand the Market Trend
- Understand the type of Indicator
- Finding Confluences
Understanding your Trading strategy: when you Understand your trading strategy, it will helps you choose the best indicator that suits your style of trading . It will also helps you to set up an indicator based on your trading strategy. For instance, a scalper cannot be using a 50-period moving average for an analysis making because the 50-period moving average is plotted with the use of price points for the 50 days. Which cannot help the scalper alone to make a good trading decision because it only focuses on short-term information about the market.
Understand the market trend: The market can be either trending or ranging. During the trending market, a trader will consider using the trend-following indicators that would explain the market for a good market analysis. in a similar way, during a ranging or sideways market, trader can place their focus on momentum-based indicators and also volatility-based indicators to take overbought and oversold regions of price and also swing highs and swing lows. This will let the trader sell at a high price and buy at a low price as the market ranges.
Understand the type of indicator : When you are using an indicator, you should consider if it is lagging behind price or it's leading. It will helps you to be conscious in the movements of market and put the necessary trading management.
Finding confluence : traders needs other forms of technical analysis to confirm the signal given by the indicator he's currently using. Finding confluence mean we are obtaining the same signal information from another tools. The more confluence you have to back up the indicator, the higher the opportunity of increasing the efficacious of using technical indicators for good analysis
My findings
Applicable to the social outcome of interest: The indicator you'll use should be the most correct statistic for measuring both level and extent of change in the social result of interest, and it should be correctly reflect in what you intended to measure; it should be valid
based on general support – there should be wide support for the indicators you choose so they can report on a generally shared understanding of prosperity
Allow in research: there have to be good evidence on key power and factors that's affecting outcomes
Dependable over time – it should be able to be accordance and measured consistently over time to permit the accurate trend monitoring
Data sound: the indicator should be able to use high-quality statistic and the method used to build it is should be statistically strong
Prompt: The indicator should be able to collect and report regularly to make sure the indicators are giving up-to-date information
Very significant: the indicator should reflects progress at a very good level and is not bound to particular areas
Confluence in cryptoacademy trading
A place in the trading where two or more indicators come together to make a high-probability buy/sell zone.
“Confluence trading” is when you use two or more indicators together in trading or analysis to increase your chance of gaining in a trade.
When you use multiple trading indicators, all give the same “reading”, as a way of confirming the authentic of a potential buy or sell signal.
Confluence means any circumstance you see multiple trade signals onlu one charts and telling you to take a trade.
screenshot from TradingView &edited with PicArt by me
3. Explain how you can filter false signals from an indicator.
b) Explain your understanding of divergences and how they can help in making a good trading decision.
c) Using relevant screenshots and an indicator of your choice, explain bullish and bearish divergences on any cryptocurrency pair.
When indicator and price move in the difference direction, we tend to say that the indicator has given a false signal
To filter false signal from an indicator, check the price action and see the market reaction after the signal given by the indicator. If the indicator gives a signal and the market also reacted towards it, then the signal is a correct one. But if the market gives an opposite reaction, the signal is fake one
When a trader use two or more technical indicators on a chart and he receives one signal from an indicator but the others didn't give a signal, by looking to a noise-cancelling chart, the trader would confirm the false identity.
My understanding about divergence
Divergence is an event where the current price of an asset moves in the different direction to the technical indicator.
Divergence is when the price of an asset moves in different direction to what a technical indicator point out for trader. And when a stock Divverse, it signals that the trend is weaker in price and the start of a reversal.
How Divergence can help in good trading system:
To make good trading system, trader need to follow understand the two types of divergence which are bearish divergence and bullish divergence
Bearish divergence happens when the indicator is giving a lower low formation and the price is giving a higher high formation. The lower low formation means the trend reversal of price even if the price is showing a bullish signal. It means the bullish price trend is weak and once that happens, reversal is expected to occur
Bullish divergence occurs when the indicator gives uptrend signal by formation of a lower high, and the price action give downtrend signal by lower-low formation. Bullish Divergence simply means that the downtrend is coming to an end and reversal to the upside is possible to happen.
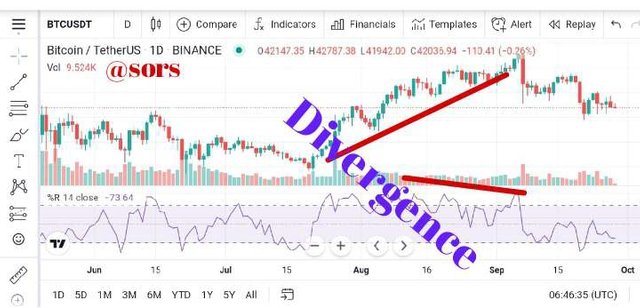
screenshot from TradingView &edited with PicArt by me
Conclusion
For successful trading, Lagging indicators, Leading indicators are needed but how to make use of them and where they are needed is what trader should take note. The Confluence and Divergence needs proper noticing as well to avoid running into fake signal and make unsuccessful trading.
Hello @sors, I’m glad you participated in the 4th week Season 4 of the Beginner’s class at the Steemit Crypto Academy. Your grades in this task are as follows:
Observations:
Unfortunately, you have copied your work directly from the lesson without any reference. This homework task was given to test your understanding of the topic.
There's zero tolerance for plagiarism in the academy.
Cc: @endplagiarism
@sapwood.
Without any reference? In that work, I used your explanation and my own findings. So which tools did you use that indicate plagiarism?
And you need to show me the link to the plagiarism
Cc: @steemcurator1
Cc @stermcurator2
Cc @sapwood
I wonder what you are trying to justify. You copied the lesson given and failed to produced your own original content.
Plagiarised content.
Original content.
Cc: @endplagiarism
@sapwood.
I wonder why you don't understand either, you should have add it to your assignment rule that you want research from other source, not from your own source. How can you take that as plagiarism? Is it word to word? Is it a crime as I explained what I learnt from your course in a way you explained it? I didn't only do that, I added my own findings. So how can you just condemn the assignment I did for days and still claim its plagiarism without presenting link to it?
OK let's assume I copied your work which I claim its an explanation, didn't you find my own findings? And is it word to word?
If it's marked by another, I'll take it as a mistake but how would you even know I understand your course without your explanation with my own research?
I'm sure @endplagiarism would find link to the plagiarism before he count it as plagiarism. I added your explanation and then my understanding