Tron Fan Club | Understanding the Basic Trading Trends and Strategies| By Solexybaba
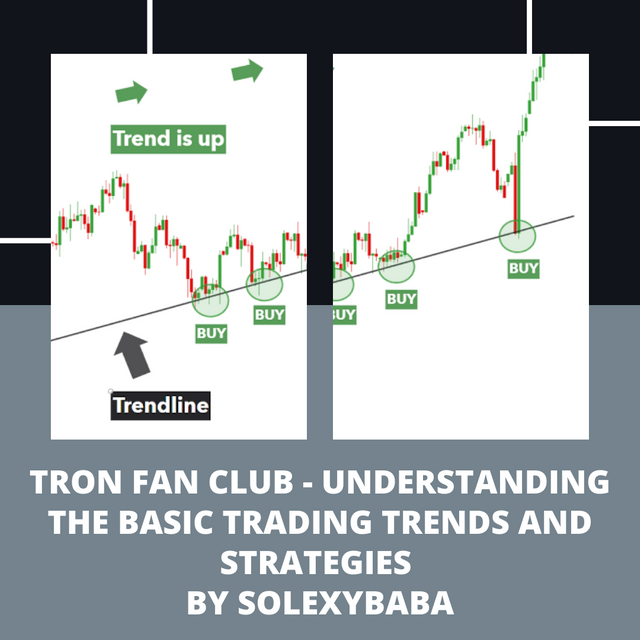
Image edited on Canva
Hello to everyone here in this great community known as the Tron Fan Club I believe we all are just doing well. Today is the start of a beautiful weekend in my country Nigeria, and I will like to talk about an important aspect of Trading. A lot of people trade without understanding some features and then they tend to lose a lot of money just because of a little mistake. today I will be talking about a basic topic called Understanding the Basic Trading Trends. by the end of the lesson, I strongly believe that most of us, especially newbies will be educated and hence understand the basic trends in trading cryptocurrency. sit tight and enjoy the article.

WHAT IS THE MEANING OF TREND IN TRADING?
The word trend in trading simply denotes a particular style movement that aims at capturing profits through analyzing a movement of assets in a given direction. so it is a style movement that tells us or gives us the particular direction an asset is heading to. with this style movement, we can now know the direction of the assets, if the asset is moving either upward or downward. the trend tends to tell us what is happening in the market during a specific time and also with this idea we are intimated and then chose our next action of trading. the trend also assists traders to analyze the assets before executing the trade, it gives details of the assets such as price momentum, previous performance and activities, the historical trends, and so on. the trend style movement uses different indicators to assist in getting the appropriate movement of the assets. so when the momentum of the asset moves in both an upward or downward direction it is known as a trend.
The trend movement is of three types. we have the uptrend, downtrend, and sideways trend. the uptrend, sideways trend, and downtrend are the major forms of trend and I will be highlighting them one after the other.
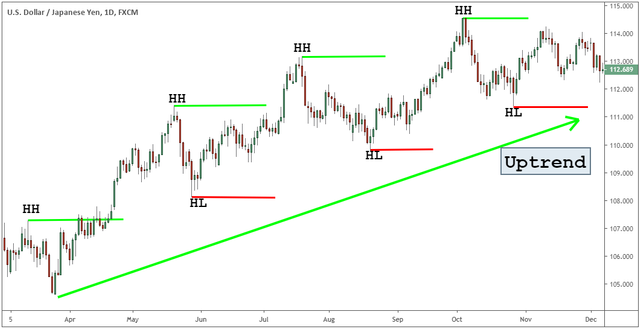
The uptrend can be seen as the total increase in asset value. this tells or shows us that the price of particular assets has gone up, and in trading, this is the point that you are expected to make an entry order whether to buy. most individuals or users do not understand this, they tend to just enter the market without knowing the trend style of the market. it is expected that we keep this in mind if at all we want to be successful in our trade, knowing the basic style momentum and when to place our order is very vital and also the uptrend movement gives the signal to the trader as though a long position is taken by the trader to make profits from that asset. a clear example of an uptrend is when an asset price increases by Rs.40 and then it reduces by Rs.20 and also goes up by Rs.30 then such price is considered to be on an uptrend momentum. because it clearly shows the price movement as higher highs and high lows. below is an image of an uptrend style movement.
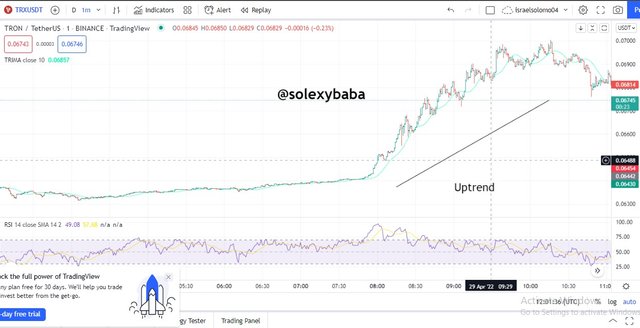
Screenshot from Tradingview
When the price goes up, the trend style takes an uptrend movement as seen in the above image and most time trader enters the market at this point to make a trade and gain profits.
The downtrend is seen as the point when the price of an asset depreciates. when the price of an asset takes a downtrend style movement, it indicates that the price of the particular asset has gone down. at this point many it is advisable to purchase assets and hold until when the price of the said asset takes another trending style by rising again then at that point one can make a sell order and gain profits. the downtrend gives us a clear description that the value/price of the asset has degraded and therefore if we already have that asset at hand we wait till the asset price has taken another trend movement which is an uptrend movement and then we sell, so in a nutshell, a short trade position is always executed. for instance, if the price of an asset decreased by Rs.40 and then increases by Rs.20 and also falls by Rs.10, therefore a downtrend formation is displayed or formed on the chart and this denotes a clear scenario in price as lower highs and lower lows in the asset price. a clear description of a downtrend movement is described below.
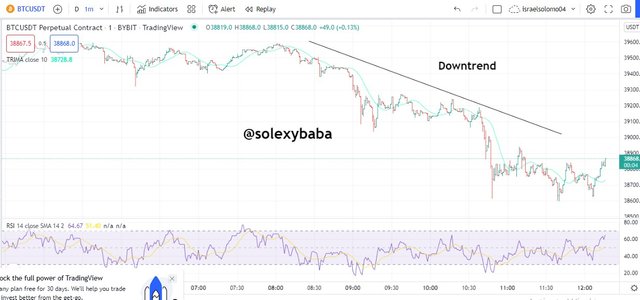
Screenshot from Tradingview
Sideways trends tend to form whenever the market is in a particle position. this is the situation whereby the market or the price of an asset neither gets to the highest highs nor lowest point in the price range. most traders do not take the sideways trend seriously, they do not regard it as anything but then traders that are scalp trading gain more advantage from the sideways trend as though they gain by opening a short-term investment trade to make the best part of the sideways trend momentum. the sideways trend takes place whenever the force of demand and supply come to a near-equilibrium state. a clear example of the sideways trend is seen below.
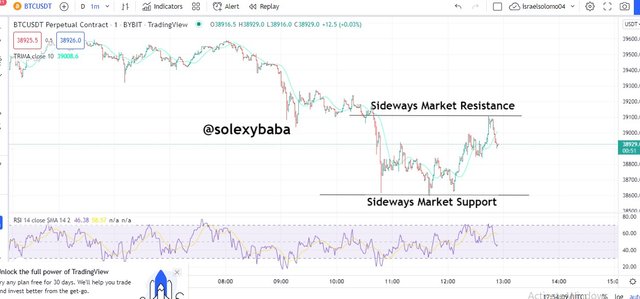
Screenshot from Tradingview
It is expected that we all know these things, as traders you do not just start trading without noticing the market trend. knowing the market trend will you know what kind of trade you are expected to execute. your positioning is determined by the market trend momentum. now, why not look at the basic trend strategies.
WHAT ARE TREND STRATEGIES
Trend strategies help a trader identify the trend that an asset is moving on in the market. this help trader to know if the asset trend is on an uptrend or a downtrend and also if the market is on a sideways trend in other to know the kind of trade position he/she is to execute. the trend strategies give accurate information regarding the movement of the asset in question.
There are various types of trend strategies that assist a trader to get a clear view of what is happening in the market and these strategies are as follows.
- RSI INDICATOR
The RSI indicator is fully known as the Relative Strength indicator. the RSI indicator assists trades to know the movement and what is happening in the market price of an asset and also it helps to showcase/indicate the signals concerning the overbought and oversold regions. also the RSI indicator is displayed as a percentage that is unstable and takes certain motions from above 70 to below 30.
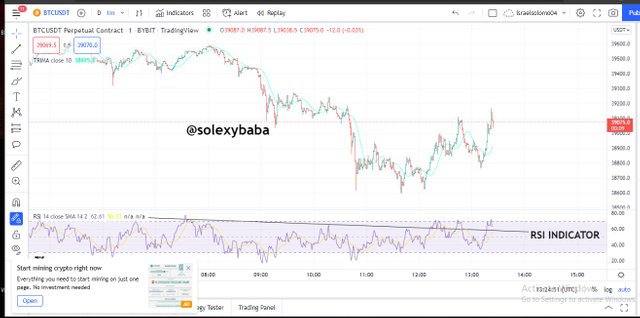
Screenshot from Tradingview
- MACD INDICATOR
The (MACD) indicator in full is known as the Moving Average Convergence Divergence. the macd indicator helps to view the average asset price over a particular period in other to assist traders in identifying the trend-momentum of an asset in the market. this indicator is the most used and it is very effective in analyzing the market trend, it indicates an uptrend if the price of the asset is above the indicator and shows a downtrend in the market if the price of the asset is below the indicator.
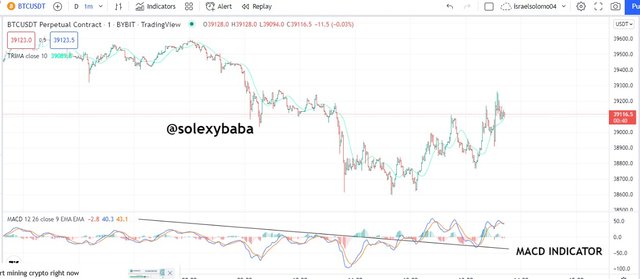
Screenshot from Tradingview
- ADX INDICATOR
The ADX indicator is known as the Average Directional Index. Traders often make use of this indicator very well. the indicator help in analyzing asset price trend vividly. this indicator helps to evaluate or assess n asset price strength in all ramifications good or bad. the indicator is having a line on it, and this line is responsible for changes in numbers from zero to 100. if values such as 25 to 100 are displayed by this indicator it denotes the fact that a solid market price trend is taking place and if it drops down beneath 25, it indicates a weak market price trend is happening.
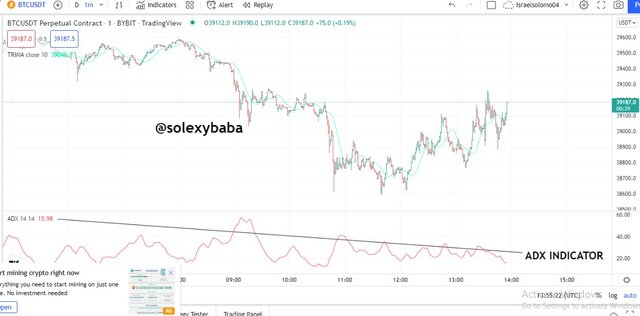
Screenshot from Tradingview
CONCLUSION
It will be of great help if we put this in our mind, knowing the basic trends and strategies to use in executing trades are very crucial, it will help us to be good traders and also avoid unwanted situation during trading our assets. thank you for taking your precious time to read my article. Greetings!
Twitter shared
Check out Israel Solomon (@IsraelS49407699): https://twitter.com/IsraelS49407699?t=4oHUEvNCXZFwg_L0N3VIbA&s=08
Very informational post, thank you. Which among the 3 trend strategies would you personally use?
Personally, i prefer to use the RSI indicator strategy because it shows the signal on relation to the overbought and oversold region and also indicate what is happening in the market. It also help me to know the kind of position i am expected to take, be it a long position or short position.
Great dear. Your shared an important content to us. Thanks a lot dear
It is always good to update the platform in other to educate especially newbies. Thank you for your kind words. Greetings!
That's fantastic, sweetheart. You provided us with valuable information. Thank you so much, sweetie.
Thank you so much for your kind words. Greetings!
Today you have explained the Basic Trading Trends and Strategies very clearly and efficiently. It looks like you have a good knowledge of this field. Keep writing such valuable articles with us.
Thank you so much for your kind words, i will keep writing about trading in other to make our knowledge vast on it. Greetings!
Understanding trends and strategies can be the difference between a huge profits or lose so it important to know what the market is saying through trends and then apply Strategies than you are good to go. Thank you good post.
Trends are very important when it comes to trading because a trader is supposed to be careful in other not to counter trade which is very risky.
So identifying trends is the first and the basic thing for a trader to know.
You have spoken well my brother. Greetings!