Tron Fan Club| Understanding Technical Indicators - By @solexybaba|10%payout to the community account
Image edited on Canva
Hello to everyone in this great community known as thee Tron Fan Club How was the weekend? I hope we all had a beautiful time with our families? I welcome you all to a great week alongside a wonderful lesson regarding crypto trading. we have been talking about trading using some indicators to analyze our chats and I just figured out that most newbies might not be conversant with the indicators, and today I have chosen to talk about a significant topic which I have tagged Understanding Technical Indicators. It is so important that we, first of all, understand what these indicators are before applying them to our chart. so today I will be buttressing more on that, so sit comfortably and I wish you happy ready.

WHAT ARE LAGGING INDICATORS?
When an indicator is called a lagging indicator, just the way other indicators work, they assist in determining a future trend potential in the crypto market but when we talk about the lagging indicators, It is contrary to that fact, so the lagging indicators can not tell the future trend of the market because it is a lagging indicator and as such can not show the next market trend, so the only work of these indicators only denote or depicts what the market has done already. that is it can only reveal the previous trend movement of the crypto market.
The lagging indicators are a basic type of indicators equipment that affirm certain market trend movements that are either in process or trends that are concluding already. certain investors that are trading in the market often made use of the lagging indicators to analyze their chart in other to see what the market has done already and with this one can predict the next movement of the market trend. so the lagging indicators do not confirm an incoming trend market movement but they show us signals and trends of the market. they also do not predict what movement is to be taken by the market, so in a nutshell, they only portray certain details regarding the movement of the trend of an asset value.
There are several lagging indicators and one of these examples is known as the Bollinger band indicator whenever it is being employed on a chart, it portrays what the trend the market is coming from, and the market volatile width but does not give us clear details regarding the direction of an incoming trend movement. so below are certain types of the lagging indicators.
Parabolic SAR Indicator
Bollinger Bands Indicator
Exponential Moving Average Indicator (EMA)
Bollinger Band indicator
MACD Indicator.
So I have just done justice to the lagging indicators by explaining what they represent and as well their work and activities on the crypto trading chart and I also gave a few examples regarding these indicators. so the lagging indicators in a nutshell do not predict the market's incoming trend movement but rather display what the market has done already and reveals to us the trend or direction the market is coming from.
WHAT ARE LEADING INDICATORS?
.jpeg)
Just as I have explained the lagging indicators, the leading indicators are wonderful indicators that when applied to our chart, reveal to us the historical price trend of a particular asset and as such assist an investor that is trading in the crypto market to determine or predict an incoming trend movement and price actions of an asset. so with the leading indicator giving us the details of the action of the crypto market regarding the said token, we get to the movement of the currency that has been given to us by the indicators, and with that information, a trader can then expect a certain trend of the asset in the crypto market and then execute his trade regarding the direction he chooses, be it a buy trade or a sell trade. and then takes advantage of such movement by making gains in the market. and when the market moves in the direction he predicted, then with his decision to enter the market before the market began to move in his favor, he has begun to make a profit already.
But then, we also have certain demerits of the leading indicators, and one above all is that, on seeing a market trend by these indicators, we are not sure of the signal confirmation regarding its accuracy, because just as we said earlier, it is a technical tool that was built by men. so there are always risk attached to these indicators. with the help of these indicators, one might notice an incoming trend and then execute a trade, there are tendencies of the market not going in the direction that was predicted or revealed by these indicators. so just as we all know, the crypto market is highly volatile and anything can happen at any given time. so losses are also inevitable when using the leading indicators but they as well tell us what is likely to happen in the market through the movement on the chart.
Nevertheless, these indicators enable traders to expect a certain movement in the price of an asset in the crypto trading market, and also we may likely see the signals before the beginning of the trend, just as the lagging technical indicators can only reveal to traders what has happened in the market or the market movement that is just finishing. and below are a few examples of the leading indicators that we can make use of.
Williams %R indicator
RSI indicator, which is known as the Relative Strength Index indicator
Fibonacci Retracements Indicator
Ichimoku Kinko Hyo Indicator
Support and Resistance levels
GIVE A CLEAR DESCRIPTION OF BOTH THE LEADING AND LAGGING INDICATORS?
For more emphasis, I will be giving a clear example of both the leading and lagging indicators, reason is that we all should see how it works on the trading chart.
I will be using the Bollinger band indicator to carry out this example as though it does not depicts the movement of an asset price in the market nor a trend reversal/continual movement, so what it does is estimate asset market volatility and then forms a band where the price of an asset in the market is likely to remain at a particular time.
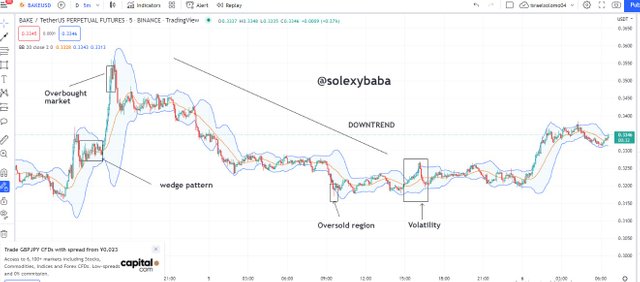
screenshot from Tradingview.con
From the above chart, we can notice the volatility in the market as this depicts the tendency of a strong trend in the price of the BAKE/USDT in the market, but when we notice a small band tight thus portrays low volatility and actions in the market.
In the leading indicator, I will carry out this example using the support and resistance levels. but before I do that, allow me to explain what the support and resistance level indicators entail.
The support and resistance levels are straight lines that are drawn on the trading chart. it is a horizontal line that is drawn on the trading chart to show the movement and actions of the price regarding a particular asset. and this is drawn, for instance, when the price of an asset goes up to a certain level and then it got to a point which it refuses to go any further and takes a downturn than that point where it stops going higher is known as the resistance level, while when the price of an asset goes down and then stop to retrace in an upward direction, then that point where it stops going down and took an upturn is known as the support level. so the support and resistance level are often used by scalp traders who just enter the market and takes profit more often.
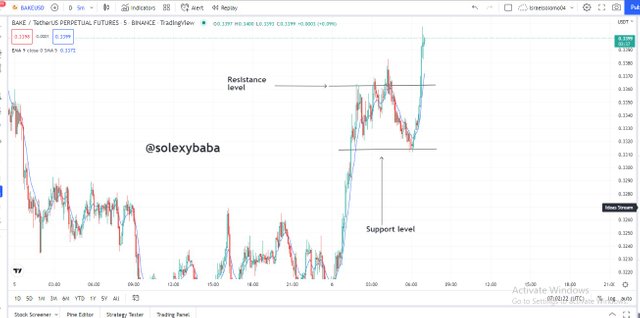
screenshot from Tradingview.con
So as you can see from the trading chart of BAKE/USDT, the support and resistance levels were marked. the resistance level was drawn just as the price got to a higher position and then refused to go up because of the pullback force in the market, this denote that sellers were now dominating the market and after a while, we noticed an uptrend in the market at when the price stops going down and the retrace in an uptrend so, at that point, my support line is drawn that means buyers are now dominating the market, so this gives a clear buy signal to a trader and as you can see if a trader had picked up this signal immediately, he or should have been making a profit by now as though the price has exceeded the previous support level so this is a sure buy trend.
SOME FACTORS TO TAKE NOTE OF WHEN MAKING USE OF A TECHNICAL INDICATOR
Well, there are some factors to consider when making use of just an indicator, and a few are listed and explained below, as this is necessary to bear in mind before executing a trade.
It is very vital to know this, as a trader, you do not have to rely on an indicator as though we all know that they are not correct, yes they can predict market trends and there are possibilities that the market might not go as the indicator has predicted. the indicator can only be sure of the previous movement of the market and also the price action but it is never sure of the future trends of the said asset.
If you are following my lessons, in the previous topic, I made mentioned confluence trading. and this is the aspect of combining multiple indicators to get a clearer view of what the market is doing at that particular timeframe. so making use of an indicator might cost you so bad as a trader, one can easily make losses in the market when using just an indicator. but making use of multiple indicators will give you an edge in the market. this will help you to see the movement of the market and price actions. so do not rely on just an indicator when making your analysis before executing a trade.
CONCLUSION
With the above explanation, I hope we are now conversant with the various indicators, and also have known what they do individually. I explained that the lagging indicator does not display what the market is about to do, or what trend is likely to be seen in the market but only gives us the historical activities and market price.
Also, I made mentioned the leading indicator, which thus helps us to know what the market is about to do and the trend it is likely to take next.
thank you all for visiting. see you next time.
Twitter shared
Check out Israel Solomon (@IsraelS49407699): https://twitter.com/IsraelS49407699?t=ugOWIbTTp2bXN7SzUJR-kg&s=07
Note: You must enter the tag #fintech among the first 4 tags for your post to be reviewed.
Technical indicators are very essential in the trading. You have done well in your explaination of technical analysis. Thank you
You are right, making a chart analysis with the technical indicators will guide you on what trade to execute. Thanks for stopping by. Greetings!
The knowledge of technical indicators is very essential for every trader as it helps in minimizing loss if properly interpreted.
You are right my friend, it is recommended that the technical indicators should always be employed in our chart when executing a trade as though it gives us an edge so as to take solid advantage of the market. Thanks for stopping by.
A remarkable post indeed ✅
Thank you so much for your kind review. Greetings!
You have done a detailed explanation of Technical Indicators. In fact, you have pointed out some important detail related to Technical Indicators. Thank you very much for providing such a valuable lecture.
Thank you so much for your kind words and supportive comments. I am encouraged to do more. Greetings!