Tron Fan Club| Understanding Head and Shoulder Pattern in Trading - BY @solexybaba| 10% Payout to the community account
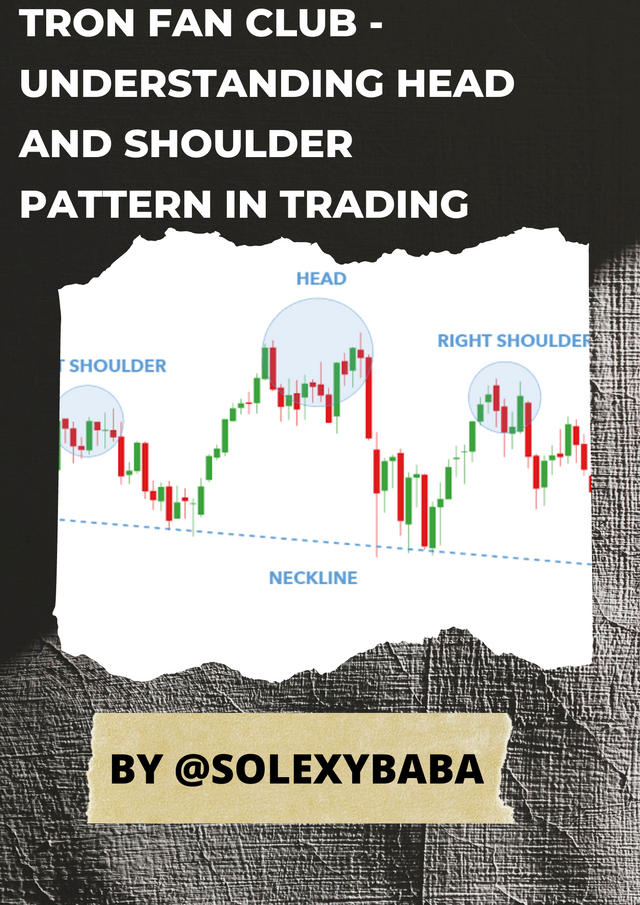
Image edited on Canva
Hello to everyone in this great community known as the Tron Fan Club Hope we all are doing just well. the lessons on trading have been great so far, and the kind of comments I get from my publication has facilitated me to do more. so today, I will also be talking about an important topic regarding cryptocurrency trading which I have titled understanding head and shoulder patterns in trading. It is a great topic to pay attention to as it helps especially traders in the aspect of the trading decision. Take a deep breath, and relax as I drop my entry.

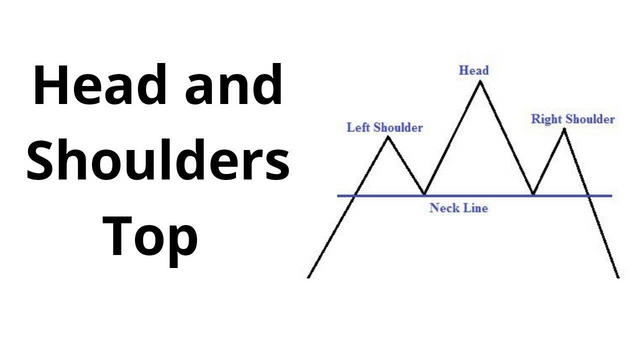
WHAT DO WE MEAN BY HEAD AND SHOULDERS PATTERN IN TRADING?
In cryptocurrency trading, when we talk about the head and shoulder pattern, it is seen as the easiest strategy among all the crypto trading strategies. with it being the easiest, a novice in the crypto trading world can be able to make use of this strategy as well as people who are well to do in the trading aspect. the head and shoulder pattern is of great importance in trading as though it enables one to point out certain points to place the profits targets and as well the danger levels while trading.
Also, we have what is called the inverse head shoulders pattern, and it is quite the same as the head and shoulders pattern but the only difference between the two patterns is that the inverse head and shoulders pattern works in an opposite direction, but then it also enables traders to set their trading setup.
The head and shoulder pattern is a trend alignment that can be used to feature the activity of the crypto market on a trend movement and thus makes it suitable for individuals that trade to make use of, and as well it is a wonderful trading strategy that is spotted easily by traders on the crypto market chart.
Normally the position where we notice the occurrence of the head and shoulder pattern is basically from the bullish spot to the bearish spot, It often starts with the market price of an asset, where we notice a rise in the value of an asset in the market and later on takes a drift down to where it all began from which is the previous price and when that happens it I called the Lower Shoulder. and after that has occurred, the price of the said asset retrace furthermore which thus make a tall pinnacle structure and it is called the head alignment and then we get to see the price of the asset in the trading market get to a lower level again, and after that has happened we get to see a high price value in the market of that same currency but a little lower than the first all-high that was seen initially and this spot takes a right angle shape which is then called the right shoulder. and after that has happened, the three significant alignments are then termed as Head and shoulder pattern.
After the structure is made, we will now have a straight vertical line that is termed the Neckline, and it is at the range in which we notice the price of the said asset falls and takes the position of the left shoulder alongside the right shoulder on a particular position.
The Head and shoulder pattern facilitate a sell order trade when executing a trade in the crypto market. so at this point what a wise trader will do is that, on noticing that the price of the asset in the market has taken a bearish trend movement after noticing that the value has taken a drift down the neckline, a sell order is then placed. this is as a result of the structural alignment of the head and shoulder pattern is well seen and accomplished and the price is like to continue on a downtrend movement beneath the neckline.
With that being noticed when using the head and shoulder pattern strategy by investors that are trading in the market, one can then exit the market to limit the loss of funds.
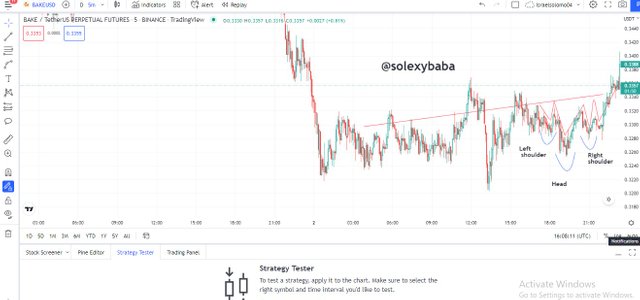
I will be making an example as seen below, as seen below, the head and shoulder pattern that is been structured on the BAKE/USDT candle outline, and as seen on the chart, on the account of structuring the left shoulder, head, and right shoulder, the price of the asset in the market fell through the neckline, and thus confirm that it will keep going down.
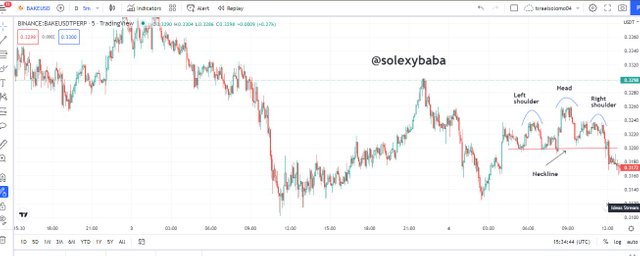
screenshot from Tradingview.com
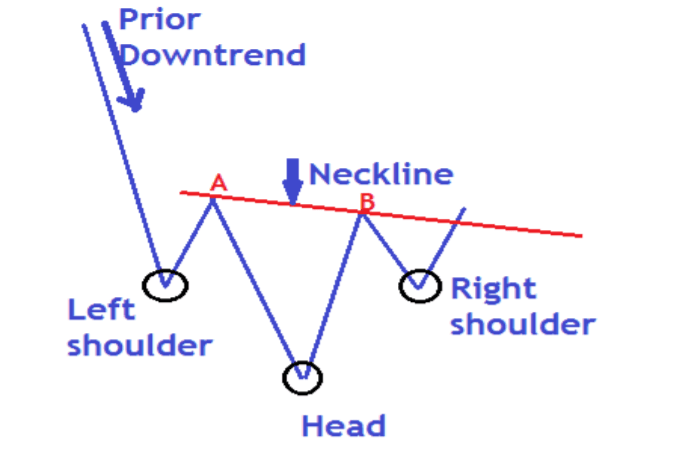
As I earlier explained, the inverse head and shoulder pattern is the vice versa of the head and shoulder pattern as though it occurs inversely. taking a total opposite movement when compared to that of the head and shoulder pattern. and this often occurs in a downward movement in which the asset price keeps going down and then retraces back from the downward movement to an upward movement. this happens when the price of the asset takes a new turn from the bearish trend to the bullish trend movement which thus makes the left shoulder shape, afterward we then get to see a fall in the price of that said asset and also get a rise in value again which thus makes a head structure, also we then notice a fall in the price of the asset again and this time could not create a new low in price value but failed to attain on the same line alongside the head and thus forms the right shoulder structure.

The neckline as seen in the above image is at the position where we notice a rise in the asset price which follows the left shoulder alongside the right shoulder on a spot.
The inverse head and shoulder pattern confirm a buy trade to be executed as though traders place their buy entry order at the position when we notice an uptrend in the market asset price beyond the neckline. and that is done due to we have noticed the complete structure of the inverse head and shoulder pattern, so as such the asset price is likely to continue on an uptrend movement above the neckline.
So on noticing the complete formation of this structure, investor trading can now use this as a buy confirmation to dive into the market in other to make gains alongside the other traders who have also executed a buy order in the market.
The below image shows a typical example of the inverse head and shoulder pattern which has been structured on the BAKE/USDT candle outline, and as it was making the structure of both the left and right shoulders, we get to see that the price of the asset took an uptrend passing through the neckline, as this confirms the asset price rising up and vividly denotes an uptrend and possibly the market will continue in that manner.
screenshot from tradingview
CONCLUSION
The head and shoulder pattern is said to be the easiest trading strategy that both professionals and novices make use of in other to minimize losses in the crypto market. it helps to confirm when to enter a sell market as though traders can see it typically on the chart, showing a head and shoulder structure and noticing the price going down the neckline they immediately execute a sell other to take advantage of the make. likewise, the inverse head and shoulder pattern help traders also to know when to execute a buy entry though we get to see that after the inverse head and shoulder pattern is formed, the price then takes an uptrend movement above the neck and thus confirms a buy trade. so this assist trader to jump into the market and executing a buy trade in other to take advantage of the market regarding the said asset.
Thank you all for your time, I hope this publication has been beneficial to you, see you next time.
The head and shoulders pattern is a very effective trend reversal pattern which is utilized by traders in spotting out possible trend reversals.
You have done well in your explanations.
Thank you
Yed brother, the head and shoulder pattern is an effective and the most easiest strategy in trading. Thank you for your kind words. Greetings.
You are welcome. Continue creating your quality and educative contents. Best regards!
Shoulder Pattern New You have cleared in a very beautiful way. In fact, there is a lot to know about the current state of the market. Good luck to you.
Exactly there are more brother that is why i am starting from the basics. Thank you for visiting.
Twitter shared
Check out Israel Solomon (@IsraelS49407699): https://twitter.com/IsraelS49407699?t=fYoKvgt0miLxZKlB4ciYlg&s=07
Note: You must enter the tag #fintech among the first 4 tags for your post to be reviewed.
Thank you so much for stopping by @fredquantum
you have done a great job and its also interesting to read Thank you of course for sharing here and people can read it too
Yes and it is the idea, so that everybody will learn from it. Thank you for visiting
This pattern is really very important for a trader. Thank you very much for discussing this very nicely.
Yeah sure, it is the easiest and most efficient pattern so far that can be understood by amateurs and professionals. Thank you for visiting.
The Head and Shoulder Pattern is a very useful Candlestick pattern that we are using in the Technical analysis part. You have nicely explained it with some additional details. Personally, I have used this pattern to take some entries, especially since this pattern considerably works well in the larger Time frames such as 1D.