Tron Fan Club| Understanding Confluence Trading in Cryptocurrency Market - By @solexybaba | 10% payout to the community account
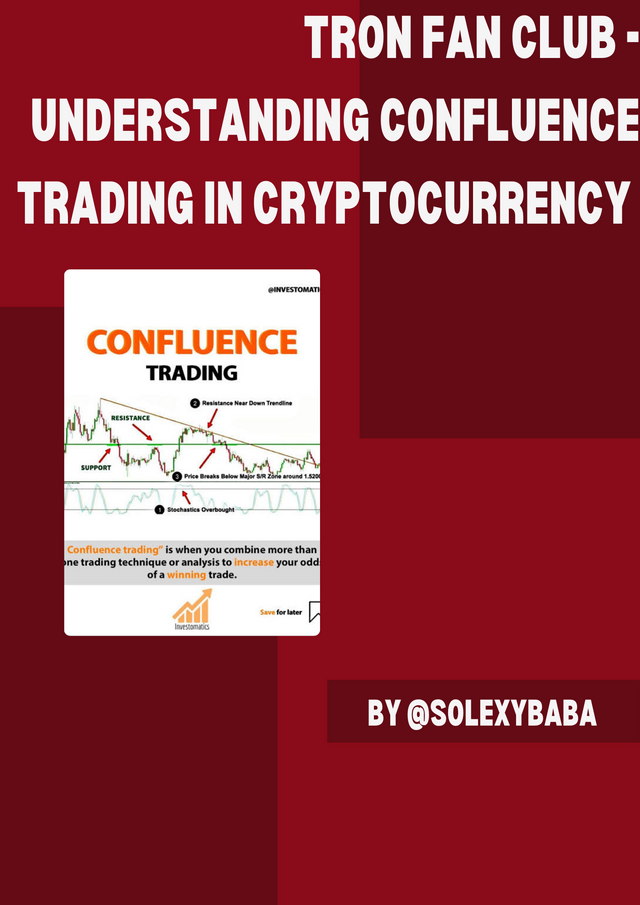
Image edited on Canva
Hello to everyone in this great community known as the Tron Fan Club Hope we all are doing just good? Today I will be focusing on an important topic regarding trading in the cryptocurrency market and this topic that I will be sharing with us today will help especially traders to take solid advantage of the crypto market while trading. I have titled today's lesson as understanding confluence trading. so I beckon on us all to sit tight and relax while I drop my entry.

WHAT DO WE MEAN BY THE WORD CONFLUENCE TRADING IN CRYPTOCURRENCY MARKET?
The word confluence trading in the crypto market world can be seen as the integration of various plans regarding trading to come out with a solid trading decision. this is done by integrating several trading types of equipment and techniques in other to make profits in the crypto market while trading. so with the confluence trading strategies, when the necessary inputs that are responsible to bring out a positive outcome in trading are combined then we can have a solid confirmation of making profits in the said trade. and this is done by the application of various trading indicators, which thus display the same reading hence confirming the displayed signal on the trading chart which is either we buy long or sell short.
Confluence trading can also be called technical analysis in trading. It is also the combination of several techniques that bring about a particular strategy that engulfs several trading technical indicators which is also called the technical analysis (TA).
But notwithstanding, we can not conclude that these technical indicators do not display a false signal while making a market analysis when several indicators are been combined instead of making use of just an indicator but we tend to see a clearer signal when we combine these indicators in other to get a clearer picture of what the market is portraying. making use of the confluence strategy in trading denotes that multiple indicators are being used in other to confirm the behavior of the market. so with these indicators, we get to examine the equipment that is being employed on our chart and it also assists traders to fish out the false signals that they get to see with the help of these multiple tools and indicators.
Good integration of the Stochastic, RSI, Parabolic SAR and a lot more are a good combination in other to get a clearer look at the chart to get a clear view of the happenings going on in the market. they also help in confirming certain signals and also facilitate and enhance a good trading decision.
The confluence trading strategy is mostly carried out in the digital currency market trading and we are aware that the market is so volatile as such we do notice the instability in the prices of an asset in the market where we can see the price of an asset in a particular figure and the next period it has taken another figure be it a higher figure or a lower figure in certain timeframes. with the ability of traders seen in the market either supplying or demanding a particular asset, that is to say, buyers and sellers are constantly in the market to either buy or sell assets, most especially supplying pressure often causes an effect on the market trend. thus the movement of the market trends according to the activities of both the buyers and sellers that are present in the market and as such investors take a proper analysis of the market trend before they as well execute their trade and these traders make judicious use of many techniques and strategies to analyze the market and then make a solid guess of what is likely to be seen in the market after the trade is executed.
ENHANCING A TRADE SETUP USING THE CONFLUENCE TRADING
Before a trade can be executed, the first thing to be considered and made present is the trade setup. and also we must make sure a market trend movement is seen in the chart. we virtually have multiple trades set up, depending on the one a trader chooses to make use of but the main idea here is that we ought to make sure of certain conditions are good enough that can walk alongside the traded strategy and can as well bring profits to us after the trade.
Confluence trading is used to make an analysis of the market, so therefore it is not recommended that one only uses a single trading tool irrespective of the said tool to analyze the market because there are tendencies of the particular tool to not capture false signals just as many tools can, as though false signals are inevitable in the crypto market. so when using just a tool, one is prone to make losses when the selected tool does not capture or fitter out false results. so with the confluence trading, one rests assured to avoid any form of losses as though the combined strategies are likely to point out false signals. with the confluence trading, signals are seen clearly and results are given clearly and validly.
In other to make this explanation clear to us, I will be making use of some images below, on seeing the below image, I employed the RSI Indicator**. the RSI indicator assists traders to checkmate the happening in the crypto market regarding the activity in the price of an asset. the RSI reveal the past and present strength and weaknesses of an asset regarding the end price of a particular trading timeframe. the RSI helps a trader to know what has happened in the market regarding the activity of the asset, be it in an oversold region or an overbought region. we also get to know what is likely to happen furthermore regarding the price of the said asset. this RSI is a great indicator that has proven to be accurate in some cases.
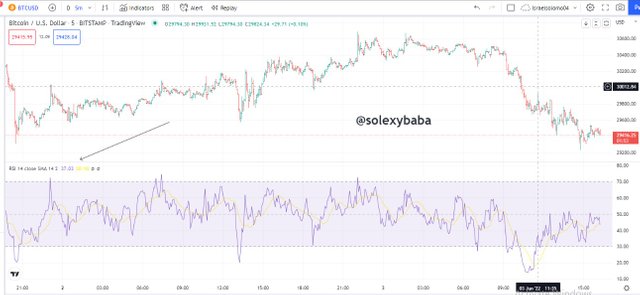
Screenshot from Tradingview.com
In as much as the RSI is a good one, we are not supposed to rely on just one indicator. as the confluence trading demands, making use of several indicators to confirm what the market is doing is quite recommended. so it is not advisable to stick to just an indicator, so making use of several indicators to confirm what the market is doing, I then employ the Parabolic SAR indicator alongside the RSI indicator. the Parabolic SAR pops out certain dots that trend with the price of an asset and with this we get to see the dots going higher when there is a rise in the price of an asset and also we get to see the dots in a downward dimension when the price of an asset fall down and lastly the dots moves in separate directions when there is a breakout in price.
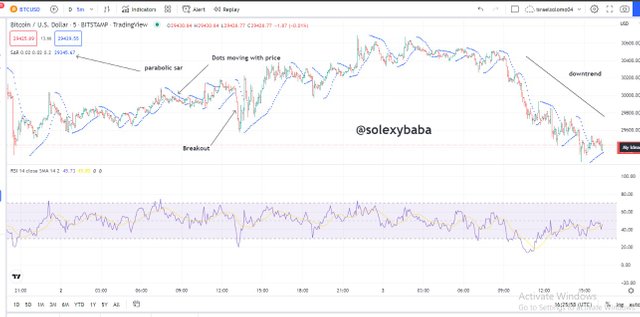
Screenshot from Tradingview.com
Viewing the above image, we get to see a downward trend in price movement and this is a result of high supply pressure, that is sellers are currently dominating the market hence we all can see that the RSI indicator is reflecting that the market is in an oversold region, also we can notice a downward movement in the market trend. and so this denotes that a sell order is to be executed in the market.
We all can see the importance of integrating various indicators such as I have done here, the integration of the RSI alongside the Parabolic Sar, and with the help of the Parabolic Sar, we get to see the movement of the price and the dot in a side by side motion and thus indicate a downtrend in the market price of the said asset.
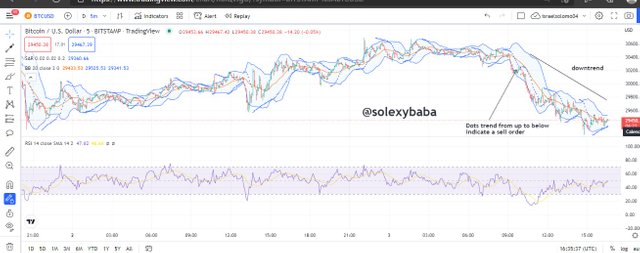
Screenshot from Tradingview.com
This trading strategy known as confluence trading is accomplished using the RSI, Parabolic SAR, and the Bollinger bands indicators. it is important to employ especially the Bollinger Sar indicator on your chart as though this is very vital and thus helps traders to see the bullish and bearish market trends. it showcases a maximum of three lines and they all have their role.
If we notice the price of an asset is with the middle and the top line then this implies that the price is at an all high value, it reveals the strength of the demands in the market and the low supply pressure which also indicate a good buy entry in the market. and as soon as we notice the value of the asset is in between the middle and the below line, this implies that a bearish trend has occurred. and thus tells us that the suppliers are dominating the market and thus confirm a sell entry, so if you are on a buy trade, one has to exit the market immediately.
This signal tells buyers that are in the market to exit the trade as though this is a sell trade signal as indicated by several indicators that I have applied on the chart. we could notice that the price of the asset is in the oversold region as indicated by the RSI indicator and also we get to see that the demand strength was in low supply, although we also view that the price was the asset was rising as proven by the Bollinger band indicator. with the image above, I have made use of different technical indicators in other to confirm what is happening in the market in other to avoid false signals when just an indicator is being employed in the chart.
Confluence trading is so vital and as such, it should be considered when one wants to execute either a buy trade or a sell trade. below is a few importance of the confluence trade.
With the help of the confluence trading, it renders helps traders in other to know better trade setups as one can employ multiple indicators to confirm the market activity
With the help of the confluence traders, a trader is assured of sighting false results and signals in the trading chart such as false trend reversals, breakouts, and trend continuation with the help of the confluence trading.
With the help of the confluence trading, investors are given an edge in the market and have confidence in themselves thereby making a great trading decision.
With the help of the confluence trading, one can rest assured of managing his or her risk so well, with the help of the strategy showing what the market is depicting at that particular timeframe. with that, a trader will take caution while trading as though it helps to minimize losses in trading.
With the help of the confluence trading alongside a good trade setup, one rest assured of a proper buy and sell entry point.
CONCLUSION
As traders embark on a trade journey always, it is recommended that one take note of the confluence strategy and not just take note of it but also apply it on his or her trading chart, as though it will help to minimize losses in trading, helps to make the best trading decisions and also give you a step ahead in the market.
Confluence trading often helps to point out false signals as multiple indicators are been used to analyze the market before a trade is executed. as I have explained, making use of multiple indicators is far better and more valid to see what the market is portraying than making use of just a single indicator.
Thank you all for your time. see you, next time friends.
Twitter shared
Check out Israel Solomon (@IsraelS49407699): https://twitter.com/IsraelS49407699?t=zVenFmaOTHgochf51yZkyg&s=07
A very detailed post on confluence trading. This is very informative and I have learnt from it.
Thank you so much for stopping by.
Finding confluence is indeed an important part of trading and you have done well in explaining. Thank you so much
Yes as though, with the integration of several indicators you get to see more details about the market such as, false break out, trend reversal and continuation. Rather than hoping on just an indicator as though you might not get a clear picture of what is happening in the market.
Thank you for stopping by. Greetings!
You have said really well, confluence is very vital as it supports the use of multiple indicators or different analysis tools in identifying what is happening in the market which will in turn give a trader more confidence in taking any trading decision
All correct brother. You have said it all!
@victoh78
You can't down okay confluence trading
I too do some sort of confluence trading using VWAP, macd and moving average