

Calvary greetings to everyone,
It's a honor once again to be in attendance in this seasons academy program. This is because there are lots of new things about trading which we are been exposed to. In this week 4, the professor in the person of
@reminiscence01 discuss extensively on the topic titled
Psychology of Trends Cycle. In this blog, I will be attempting the questions given by the professor after the lecture. So stay with me as we all ride through this together.
1. Explain your Understanding of the Dow Jones Theory. Do you think Dow Jones Theory is Important in technical analysis?
In the year 1897 a man named Charles Dow formulated a theory called the Dow Jones theory. This theory talks about how the market moves in a trend. According to Dow's theory, market movement can either be in an uptrend or in a downtrend. He stated that if the price of an asset is making a series of higher high and higher low movement, then that market is moving in an uptrend direction. Similarly, if the price of the asset is making a series of lower low and lower high movement, then that market is moving in a downward direction.
Dow's theory as we have seen forms the basis of any technical analysis we perform today. A trend is said be bullish only when it forms a series of higher highs and higher lows, similarly, for a trend to be bearish it has to form series of lower low and lower highs. The upward and downward movement of the price of an asset solely depends on some factor among which is the demand and supply. If the demand for an asset is more than the supply for the asset, the price will start moving in an upward direction leading to bullish trend. Similarly, if the supply for an asset is more than the demand for the asset, the price will start moving in a downward direction leading to bearish trend. Also, there are situation when the demand and supply for the asset will be equal and we call such trend a sideways trend as both buyers and sellers are dragging the market at that point. Traders all over the world today look at to see the price direction (Direction of the trend) before placing any form of trade, this is done this way so that we can minimize the amount of losses we ought to incur if the trade is not to our favour.
Importance of Dow Jones theory in technical analysis
Dow Jones theory is very important when it comes to trading. As a matter of fact, no trader can be successful without following the theory. We have seen clearly as explained above that uptrend movement is as a result of higher highs and higher low movement and also downtrend movement is as a result of lower low and lower high movement. This is the basis used to build any technical analysis and even the technical indicator that are trend based.
The Dow Jones theory went as far as using the volume indicator to confirm it's theory for us. From Dow's theory, if there is an uptrend or downtrend movement, the volume of the asset will increase due to the high volatility in the market at that point in time whereas when the asset is at range, the volume decreases this is due to low volatility in the price of the asset at that point in time. The volume indicator tells us if the price is in a trending direction or in a sideways movement.
The theory also works perfectly in the cases of accumulation and reaccumulation as well as cases of distribution and redistribution. In the accumulation and reaccumulation phase, the buyers take over the market by purchasing lots of asset and thereby pulling the price of the asset in an upward direction. So when this happens we know that the trend will be bullish. Similarly, in the distribution and redistribution phase, the sellers begin to distribute their already accumulated asset leading the price of the asset to drop. So when this happens we know that the trend will be bearish.
2. In your own words, explain the psychology behind the Accumulation and Distribution phases of the market. (Screenshots required).
Accumulation and distribution phases in the market are phases where the price movement make a pause for a while before proceeding to it's initial direction or reversing to an opposite direction.
Accumulation Phase
Phases of accumulation are stages in the market where the price movement of an asset make a little pause (you see a sideways movement of price at this point) and then buyers at this point purchase the asset due to the low volatility of the asset at that moment. The phases of accumulation is what gives rise to bullish trend movement because a lot of buyers will purchase asset at this point and that will lead to the price of the asset moving in an upward direction.
The phase of accumulation comes into play because of the whales in the market. They tend to slow down the movement of the asset due to different activities they will be doing in the market and after which they will provide liquidity to the market. And when this liquidity is provided, the price of the asset tends to move upward. Let's consider the chart below.
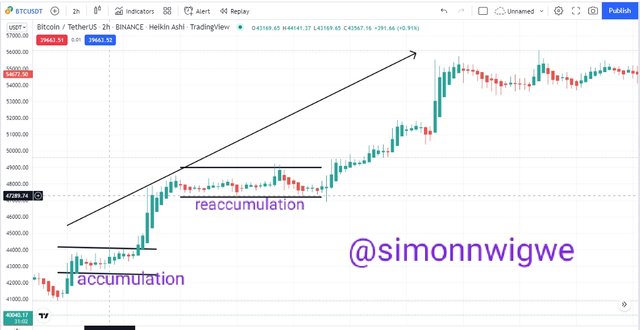
Source
From the above screenshot, when the liquidity was provided by the whales, the price of the asset started moving in an upward direction and after a while we also notice a pullback in the price of the asset and another accumulation phase was formed which we call the reaccumulation. At this phase, it also shows very low volume and low volatility as it looks like a sideways movement that occur in the uptrend movement. Let's consider the chart below.
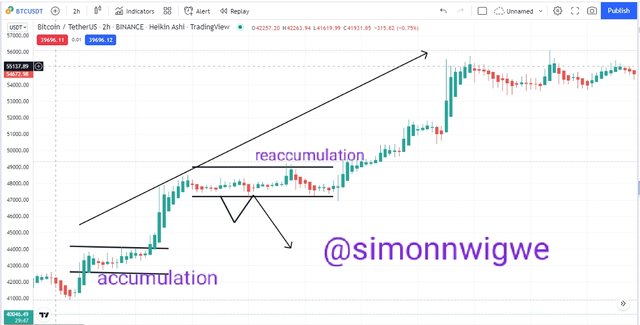
Source
From the chart above, we have seen the phase of reaccumulation. Most times traders mistake this phase to a reversal phase. And for that reason it is recommended that all traders should always wait until the trend breaks and moves downward before they confirm it as reversal phase otherwise they should be patient and wait because the trend will still move upward.
Distribution Phase
Phases of distribution are stages in the market where the price movement of an asset make a little pause (you see a sideways movement of price at this point) and then sellers at this point begin to sell their asset due to the high volatility of the asset at that moment. The phases of distribution is what gives rise to bearish trend movement because a lot of sellers will be selling their asset at this point and that will lead to the price of the asset moving in a downward direction.
The phase of distribution comes into play because of the whales in the market. They tend to slow down the movement of the asset due to different activities they will be doing in the market and after which they will withdraw their liquidity from the market. And when this liquidity is withdrawn, the price of the asset tends to move downward. Let's consider the chart below.
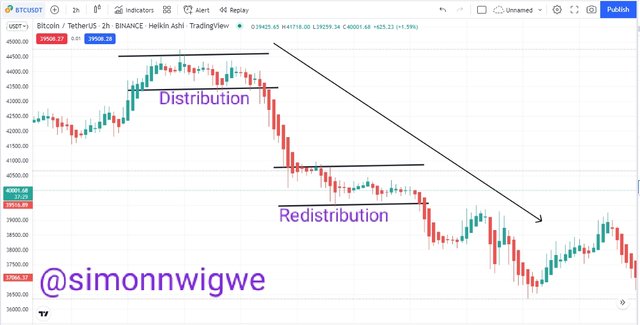
Source
From the above screenshot, when the liquidity was withdrawn by the whales, the price of the asset started moving in a downward direction and after a while we also notice a pullback in the price of the asset and another distribution phase was formed which we call the redistribution. At this phase, it also shows very low volume and low volatility as it looks like a sideways movement that occur in the downtrend movement. Let's consider the chart below.
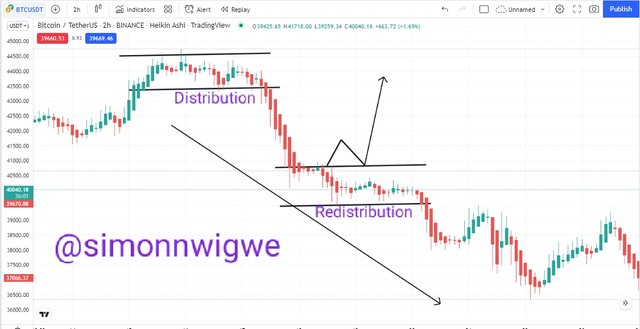
Source
From the chart above, we have seen the phase of redistribution. Most times traders mistake this phase to a reversal phase. And for that reason it is recommended that all traders should always wait until the trend breaks and moves upward before they confirm it as reversal phase otherwise they should be patient and wait because the trend will still move downward.
3. Explain the 3 phases of the market and how they can be identified on the chart.
The 3 phase of the market are the bullish, bearish and the sideways trend or phase. The details of each of the phases can be seen below.
Bullish Trend
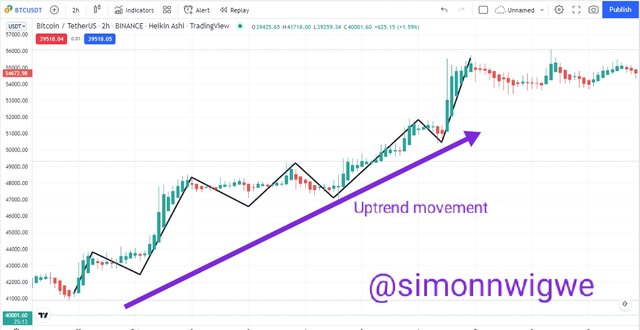
Source
The screenshot above shows a bullish trend. As you can see, the bullish trend deals with an upward movement in the price of an asset and the volume at this point is seen to be high with a high volatility. This upward movement is due to the higher highs and higher low movement formed due to the demand of the asset in question. When ever we notice price moving in an upward direction it means that the number of buyers of the asset at that point in time is more than the number of sellers.
Bearish Trend
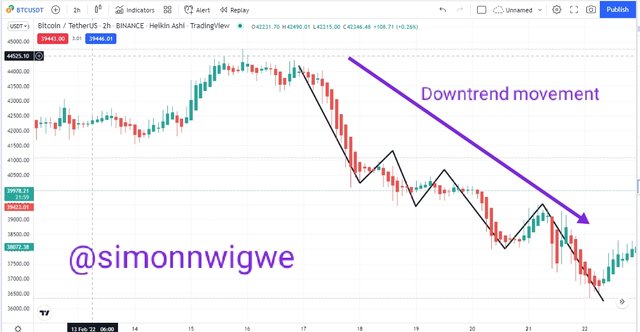
Source
The screenshot above shows a bearish trend. As you can see, the bearish trend deals with a downward movement in the price of an asset and the volume at this point is seen to be high with high volatility. This downward movement is due to the lower low and lower highs movement formed due to the supply of the asset in question. When ever we notice price moving in a downward direction it means that the number of sellers of the asset at that point in time is more than the number of buyers.
Sideways or Range Trend
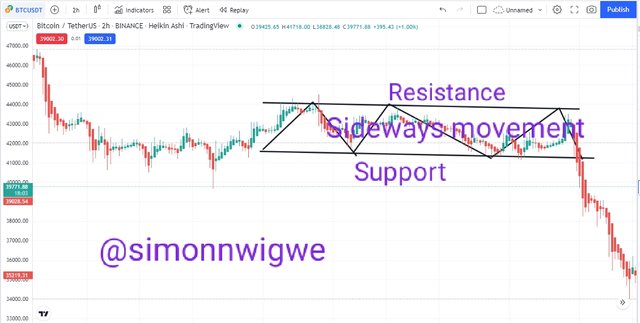
Source
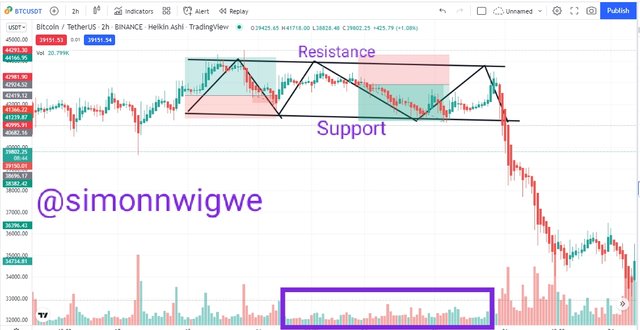
The screenshot above shows a sideways movement in the price of an asset. From the chart you will notice that the price at this point is trapped between horizontal support and resistance level. In this case we say that the demand and the supply are equal hence price will continue moving up to the resistance level and then back to the support level. Price will continue in this cycle until there is a breakout. This breakout may be a continuation breakout or a reversal breakout.
How to identify trends on a chart
Identifying a trend is the number one thing that every trader does before opening a position. There are many ways in which these trends can be identify among which include the use of trend lines, technical indicator, market structure etc. Here in this course we have been taught that the most reliable way to identify any trend is by using the market structure. Though other means can also be use to confirm the trend given by the market structure.
4. Explain the importance of the Volume indicator. How does volume confirm a trend? Do this for the 3 phases of the market (Screenshots required).
Volume indicator are majorly use by traders to know the strength of the trend. If the volume is high it implies that the trend is either in bullish or bearish movement and if the volume is low it implies that the market may be in a sideways movement. Price and volume work hand in hand. As price increases or decreases volume also increases and if the price is at range, then the volume does not increase as well.
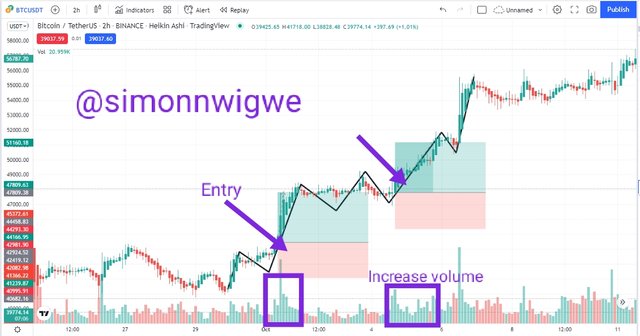
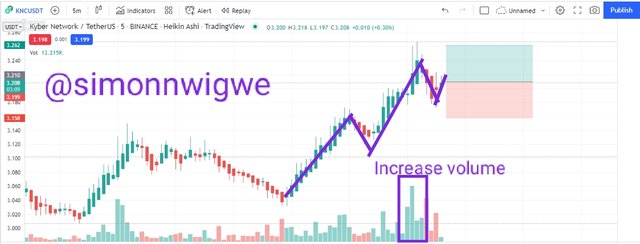
Volume and Uptrend Confirmation
The volume of the asset increase as the price makes a series of higher high and higher low. When ever this happens, the asset moves in a bullish direction and the demand for the asset will keep increasing as the supply reduces. The screenshot below shows an uptrend movement of the asset and a volume confirmation.
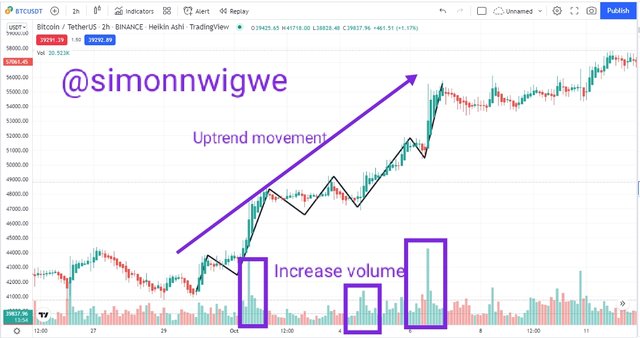
Source
The chart above shows that the price is making series of higher high and higher low movement and the volume of the asset at this point is also increasing. This means the asset is in a trending movement.
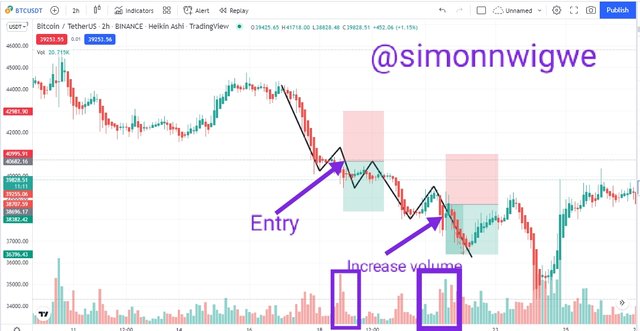
Downtrend Confirmation Using Volume
The volume of the asset increase as the price makes a series of lower low and lower high. When ever this happens, the asset moves in a bearish direction and the supply for the asset will keep increasing as the demand reduces. The screenshot below shows a downtrend movement of the asset and a volume confirmation.
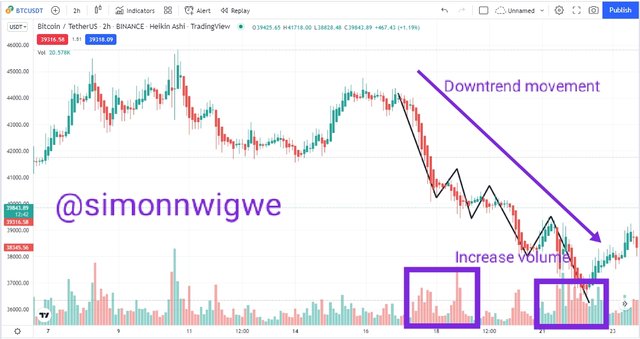
Source
The chart above shows that the price is making series of lower low and lower high movement and the volume of the asset at this point is also increasing. This means the asset is in a trending movement.
Sideways Confirmation Using Volume
The volume of the asset here does not increase and the price of the asset too is in a range. This is because the demand and supply of the asset are equal. The price here keep moving from support level to the resistance level in a horizontal manner. This phase is seen mostly in accumulation or distribution phases. The screenshot below shows a sideways movement of the asset and a volume confirmation.
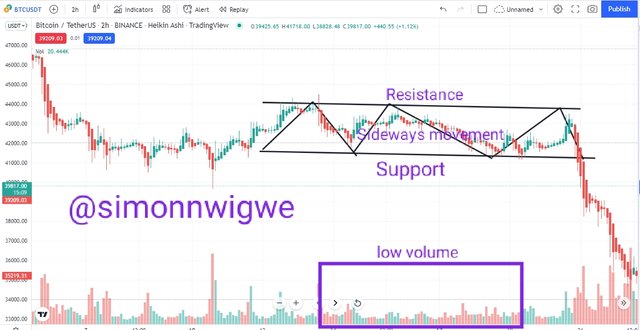
Source
The chart above shows that the price is at range, I.e the amount of demand and supply are equal and the volume at this point does not increase. This means that the asset is at range movement.
5. Explain the trade criteria for the three phases of the market. (show screenshots)
The criteria for the 3 phases of the market are listed below.
Bullish Trend Criteria
Bullish trend is where traders take their buy entry position. To take this position effectively, one need to follow the following rules
Be certain and confirm that the price of the asset is going in an upward direction I.e the price is making series of higher high and higher low movement
Confirm and be sure that the volume is increasing as the price is moving upward.
Confirm a retracement of the opposite direction of the trend and then wait for reversal before placing a buy entry.
Stop loss and take profit should be place below recent low and above recent high respectively.
A risk reward ratio of 1:1 or 1:2 should be used. Let's consider the screenshot below.
Source
Bearish Trend Criteria
Bearish trend is where traders take their sell entry position. To take this position effectively, one need to follow the following rules
Be certain and confirm that the price of the asset is going in a downward direction I.e the price is making series of lower low and lower high movement
Confirm and be sure that the volume is increasing as the price is moving upward.
Confirm a retracement of the opposite direction of the trend and then wait for reversal before placing a sell entry.
Stop loss and take profit should be place above recent high and below recent low respectively.
A risk reward ratio of 1:1 or 1:2 should be used. Let's consider the screenshot below.
Source
Sideways Trend Criteria
In other to take a position in the sideways trend, the following rules should be taken into consideration.
- Be certain and confirm that the price of the asset is at range I.e the movement of price up and down within the horizontal support and resistance zone
Place a buy entry at the support level and a take profit above the resistance level and a stop loss below the support level
Place a sell entry at the resistance level and a take profit below the support level and a stoploss above the resistance level.
Source
6. With the Trade criteria discussed in the previous question, open a demo trade for both Buy/ Sell positions.
The demo trade analysis will be done using trading view platform and the execution of the trade will be done using my paper trading account on trading view.
Buy Posistion (KNCUSDT)
Source
A piar of KNCUSDT chart was analysed as you can see in the chart above. It was a chart of 5 minutes time frame and you will notice the asset making series of higher high and higher low movement and the volume also increasing.
The price of the asset retrace and a new bullish candle appeared and then I place my order at that point. See chart below.
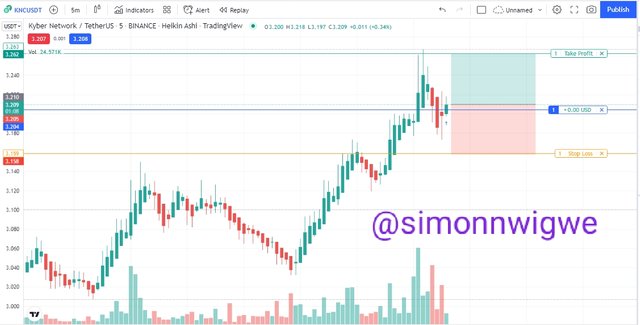
Source
The details of the trade are, entry 3.209, take profit 3.263 and stop loss 3.159 and a RR of 1:1 is used. The chart below shows the running order of the pair of asset.
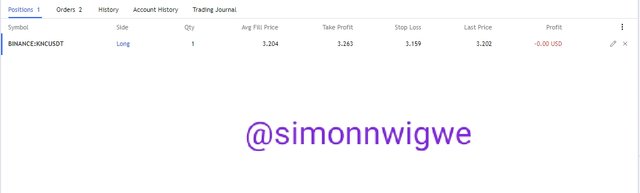
Source
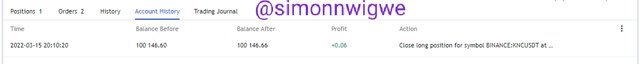
The trade executed after some minutes and the take profit was filled while the stop loss expired. A profit of +0.06 was realized for the trade.
Source
Sell Posistion(FTMUSDT)
Source
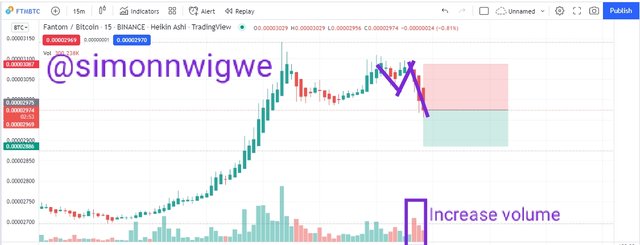
A piar of FTMUSDT chart was analysed as you can see in the chart above. It was a chart of 15 minutes time frame and you will notice the asset making series of lower low and lower high movement and the volume also increasing.
The price of the asset retrace and a new bearish candle appeared and then I place my order at that point. See chart below.
Source
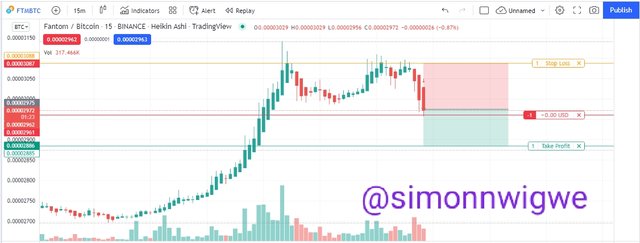
The details of the trade are, entry 0.00002972, take profit 0.00002886 and stop loss 0.00003088 and a RR of 1:1 is used. The chart below shows the running order of the pair of asset.

Source
The trade executed after some minutes and the take profit was filled while the stop loss expired. A profit of +0.03 was realized for the trade.

Source
7. Conclusion.
Dow Jones theory is a theory in through which every other technical analysis is built. All technical analysis uses the method of higher high and higher low to determine the fact that the trend is an uptrend, more also, lower low and lower high forms a downtrend. The market structure along side the volume indicator can tell us whether the market at that point is trending or is in a range. Increase volume means that the asset is trending whereas if the volume does not increase it implies that the asset is in a range.
Finally, a big thank you to professor
@reminiscence01 for such an insightful and educative lecture. This lecture has taught me new strategy to trade.
