
Hi guys,
It's a pleasure once again to be part of the academy program. This is the first week for season number six and I will be attempting the homework task given by professor
@reddileep after studying through his course titled
Leverage with Derivatives Trading Using 5 Min Chart. Let's get started.
1- Introduce Leverage Trading in your own words.
When we talk about the term Leverage Trading, we are referring to a scenario where a given trader has the opportunity to trade with a higher purchasing power despite the little capital that he/she has in the account. In other words, Leverage trading has to do with the ability of the trader in a given exchange to borrow funds and then use it to perform a trade in the exchange with the aim of making profit.
Leverage trading in a very clear terms is the ability of traders to borrow funds from the exchange and perform a trade as large as 5x or 10x the amount of their capital. If this trade goes in the right direction, then the trader makes a very large profit with his or her little capital using the borrowed funds. In the same way, if the prediction does not go as expected or the right direction, then you may risk been liquidated unless you deposit more money to cover the loss.
Just as I have mentioned above, if the trade goes in your favour as a trader, you have the chances of making a very big profit with little capital but if the trade does not go in your favour, you have to deposit more funds to cover up all the losses other wise you will risk been liquidated. So I will be explaining clearly the benefits, disadvantages and the strategy that we can apply to make a good leverage trading in the below section.
2- What are the benefits of Leverage Trading?
The benefits associated with Leverage Trading are numerous and in this section I will be listing few of these benefits.
One of the benefits of leverage trading is seen in scalp trading where a trader can use a very short time to make a very large profit. So if a trader who trades in scalp trading sees a good entry and he or she is sure of it he can borrow funds from the exchange and perform that trade and make his profit within a very short time.
In leverage trading, traders can perform 5x or 10x trade worth of transaction even with little capital that is not up to the amount the use in performing the transaction. Example a trader with $50 can be able to perform a transaction worth $500.
In leverage trading, users have the ability to take profit and exit their position when they may have gotten a desired profit and in the same way, users can also close stop loss and exit the trade if the trade is not going according to their prediction.
Due to the ability of a trader to borrow from the exchange, the trader has the ability to go into many trading without focusing on just one asset. Take for instance a trader with $50 in his or her account can borrow 10x his capital I.e $500 and can use may be $100 each to trade BTC, ETH, XRP, TRX and STEEM. If the market goes in his favour, a lot of profit will be generated.
3- What are the disadvantages of Leverage Trading?
As we all know, everything that has a good side also has it's own bad side. Despite all the benefits we have listed above about the leverage trade, there are some disadvantages of this trade as well. Few of the disadvantages are listed below.
In leverage trading, when a trade does not go in the direction of the trader, and the trader incurs loss, such trader has to deposit money to cover for the loss and if that is not done, the account will be liquidated.
In leverage trading, a trader is likely to loss all his or her entire capital if the trade goes against the position of the trader.
A very high rate of fees is experience in leverage trading since the funds are borrowed by traders. Here you pay this fee when borrowing the funds and whether you make profit or loss, it is left for you.
4- What are the Basic Indicators that we can use for Leverage Trading? (Need brief details for any essential Indicators and their purposes)
For a trader to be successful when using leverage trading, he/she has to make use two or more suitable indicator to confirm any position before entry the position. As we know cryptocurrncy trading is very volitle I.e to say if it comes to making profit we can thousands of dollars just within minutes and in the same way if it comes to loss, we can lose thousands of dollars within a very short time as well. So in other to minimize loss and maximize profit, it is recommended that we use two or more indicator on our chart analysis to confirm every position. In this section, the basic indicators we will be looking at are EMA, Parabolic Sar, RSI etc.
Exponential Moving Average (EMA)
Before the invention of the Exponential Moving Average (EMA), we have the simple moving average but the issue associated with the simple moving average is that it is a lagging indicator which means the indicator delays before given the signal. The Exponential Moving Average (EMA) on the other hand does not delay so we can say that the Exponential Moving Average (EMA) has come to solve the problem of lagging in the simple moving average.
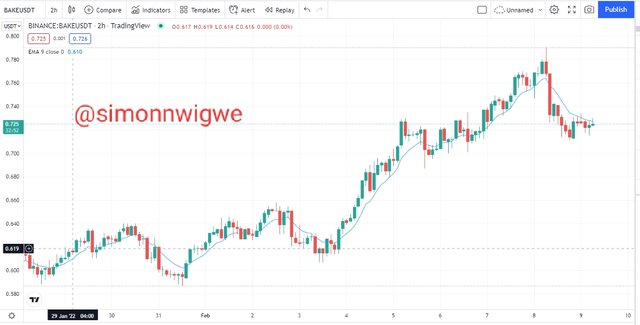
Here, once you see the EMA line below the price chart, it is a signal for bullish trend and a trader is a expected to look for a good buying position and then make entry. In the same way, when the EMA line is seen above the price chart, it is a signal for bearish trend and a is expected to look for a good selling position and then make entry. From the explanation, you will agree with me that when the EMA line cross the price chart, a trend reversal will be noticed to either bullish or bearish trend as the case may be. Let's consider the example below.
Source
EMA on chart
Parabolic SAR
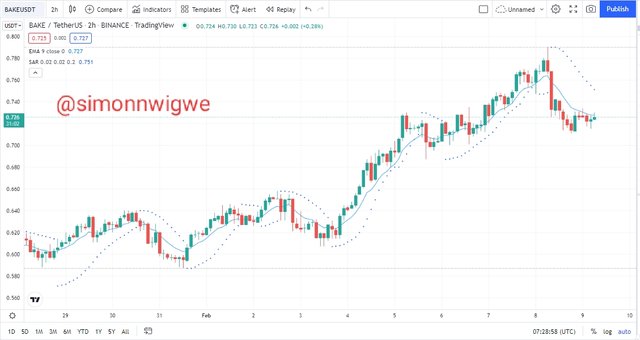
The Parabolic Sar is one of the indicators use in leverage trading to spot buy or sell opportunity. This indicator was developed by J Wilder. The indicator is made up of dots. When the dots are seen above the price chart, it is a signal that the price of the asset is about to move in a downward direction and then traders at this point are expected to look for a good position for sell. In the same way, when the dots are seen below the price chart, it is a signal that the price of the asset is about to move in an upward direction and then traders at this point are expected to look for a good position for buy. From the explanation, you will agree with me that when the Parabolic Sar dots cross the price chart, a trend reversal will be noticed to either bullish or bearish trend as the case may be. Let's consider the example below.
Source
Relative Strength Index (RSI)
The Relative Strength Index (RSI) indicator is one of the indicators that can be used in leverage trading to know when the asset is in an overbought region or when the asset is in an oversold region and then possible reversal of the price of the asset when it gets to this regions.
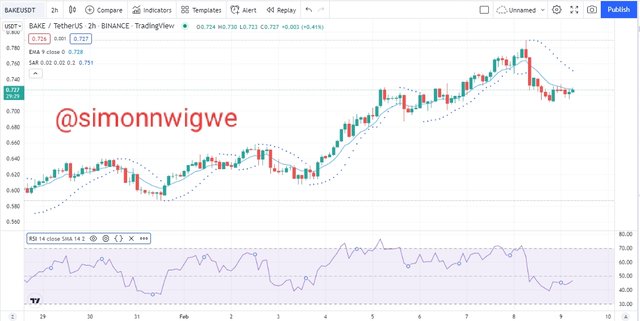
The Relative Strength Index (RSI) indicator is design such that when the price of the asset gets to the 70 and above thresholds, we say that the asset at that point is in it's overbought region and we should be expecting a strong resistance to stop the price from moving ahead, a possible trend reversal will be expected. In the same way, when the price of the asset gets to the 30 and below thresholds, we say that the asset at that point is in it's oversold region and we should be expecting a strong support to stop the price from moving downward, a possible trend reversal will be expected. In other to configure the RSI indicator, a few things can be unchecked to the traders satisfaction. From the explanation, you will agree with me that when the RSI indicator is in the 70 and above threshold or in the 30 and below threshold, a trend reversal will be noticed to either bullish or bearish trend as the case may be. Let's consider the example below.
Source
RSI on chart
5- How to perform Leverage Trading using special trading strategies (Trading Practice using relevant indicators and strategies, Screenshots required)
In other to perform leverage trading using special trading strategy smoothly, I will be using the Heikin Ashi Charts instead of the traditional candlestick chart. Let's look at buy and sell position strategy below.
Buy Position
Just as I have explained above in the previous questions, here I will be making use of the EMA, Parabolic Sar and the RSI indicator to determine my buy position. That is to say that the three indicator use must be in agreement before the position will be taken.
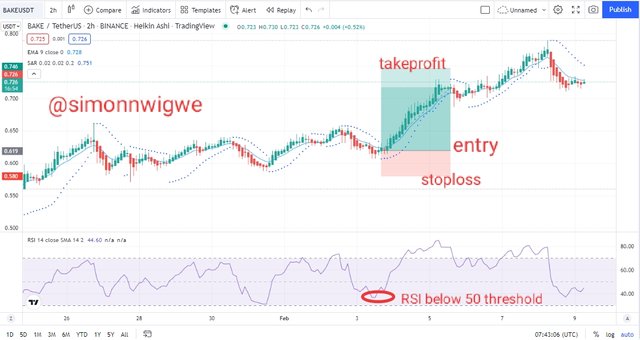
In the case of the EMA indicator, the price must be seen above the EMA line which implies that the price of the asset is moving in bullish direction. In the same way, in the case of the Parabolic Sar indicator, the dots has to be below the price chart to identify that the price is moving in bullish trend. Finally, in the case of the RSI, the RSI line must be below 50 threshold. If all these are seen then a buy position can be taken. Let's consider the screenshot below.
Source
The screenshot above shows a clear buy entry position. The EMA line is seen below the price chart and the parabolic Sar dot is seen below the price as well. Stoploss and take profit are also taken into consideration. From the chart above the take profit was initiated when we start seeing dots above the price and stop loss is place below the next dots that appear below the price.
Sell Position
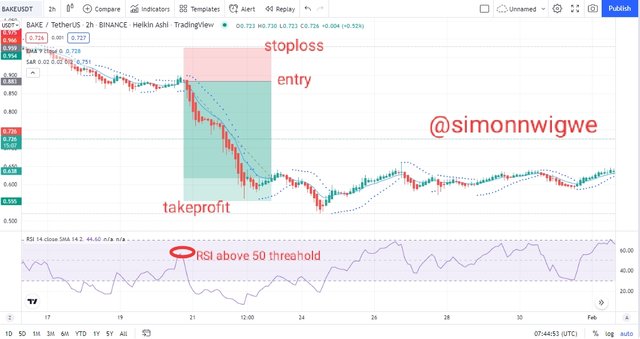
In the case of the EMA indicator, the price must be seen below the EMA line which implies that the price of the asset is moving in bearish direction. In the same way, in the case of the Parabolic Sar indicator, the dots has to be above the price chart to identify that the price is moving in bearish trend. Finally, in the case of the RSI, the RSI line must be above 50 threshold. If all these are seen then a sell position can be taken. Let's consider the screenshot below.
Source
The screenshot above shows a clear sell entry position. The EMA line is seen above the price chart and the parabolic Sar dot is seen above the price as well. Stoploss and take profit are also taken into consideration. From the chart above the take profit was initiated when we start seeing dots below the price and stop loss is place anove the next dots that appear above the price.
6- Do a better Technical Analysis considering the above-explained trading strategy and make a real buy long or sell short position at a suitable entry point in any desired exchange platform. Then close that buy or sell position after appearing trend reversal signal from the Parabolic SAR indicator. Here you can also close your Buy or Sell position using any other desired Trading Method in addition to the signal coming from the Parabolic SAR indicator. However, here you must prove that trading method as a reason for closing your position. (Usually, You should demonstrate all the relevant details including entry point, exit point, resistance lines, support lines or any o
Here in this section, I will be using the strategies discussed above to perform my analysis and after which I will execute my trade using my binance exchange wallet. The analysis will be done using tradingview website. Let's get started.
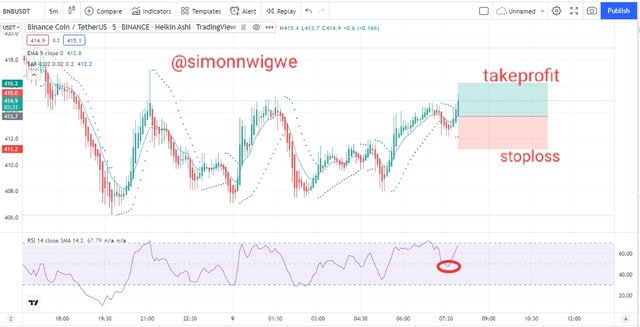
Buy Entry (BNB/USDT 5 minutes Chart)
Source
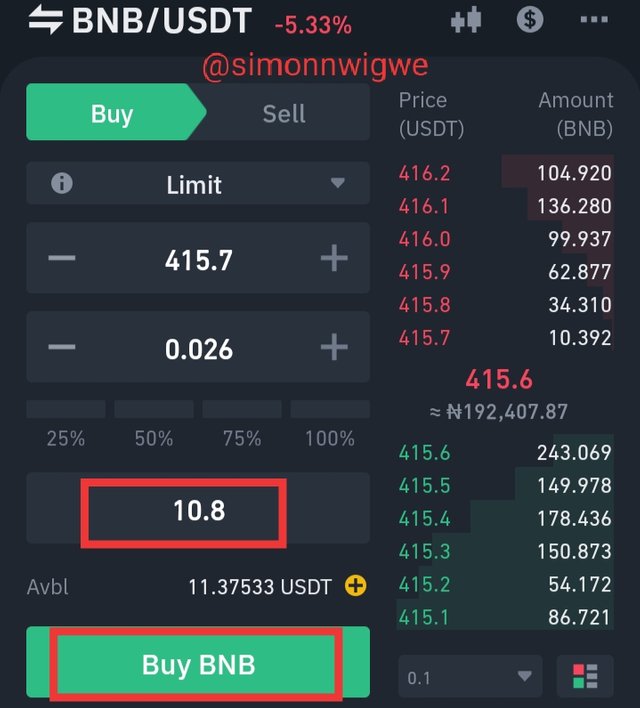
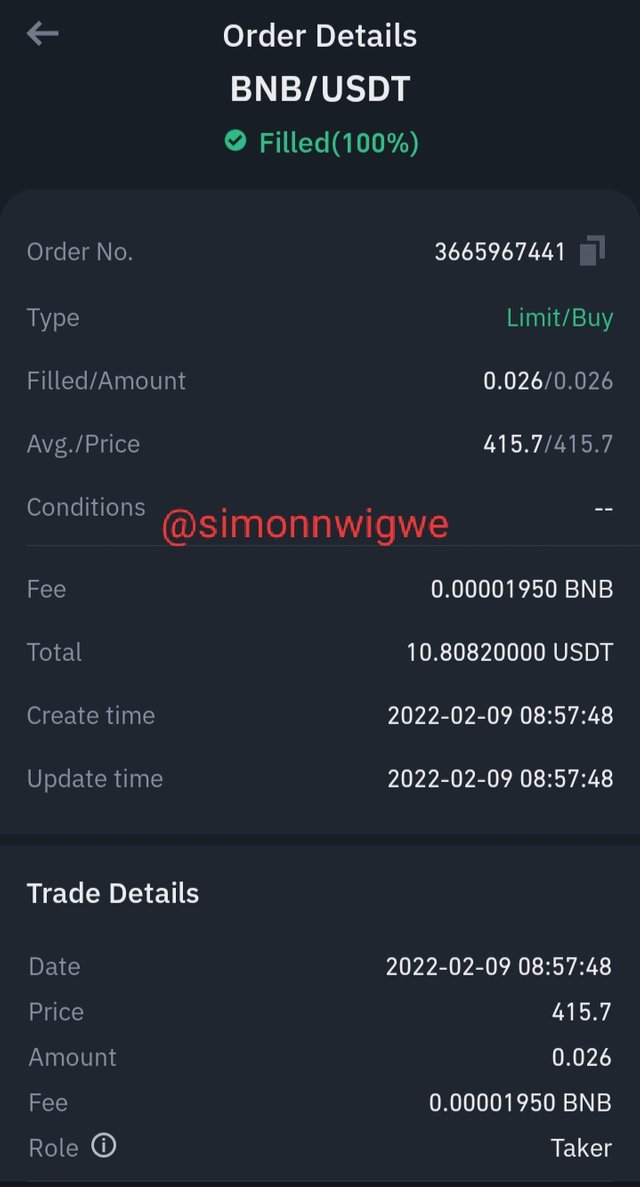
From the chart above, all the criteria listed above are taken into consideration. The EMA line is below the price, the parabolic Sar indicator dot just started below the price and the RSI is seen below the 50 threshold level. This is a clear confirmation of a buy signal hence I took my entry at that point. Here is the screenshot of my executed transaction on binance exchange.
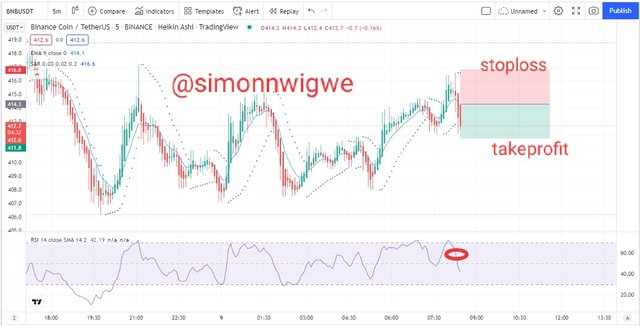
Sell Entry (BNB/USDT 5 minutes Chart)
Source
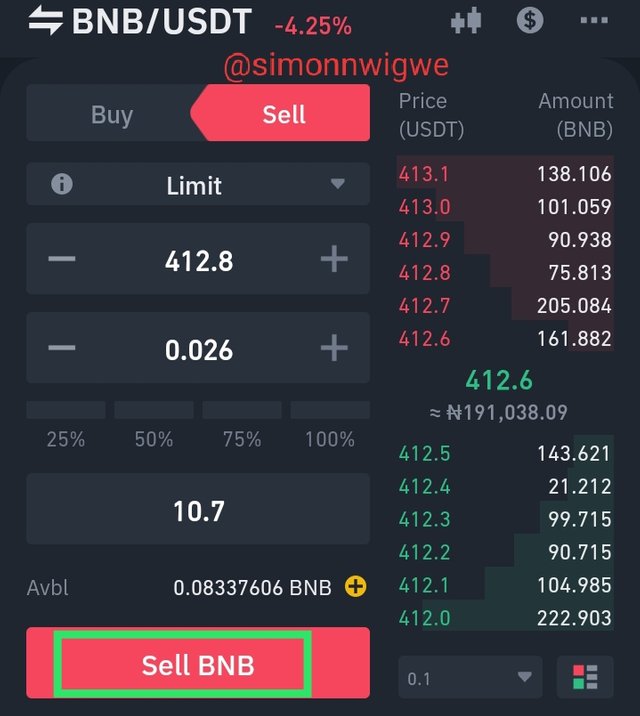
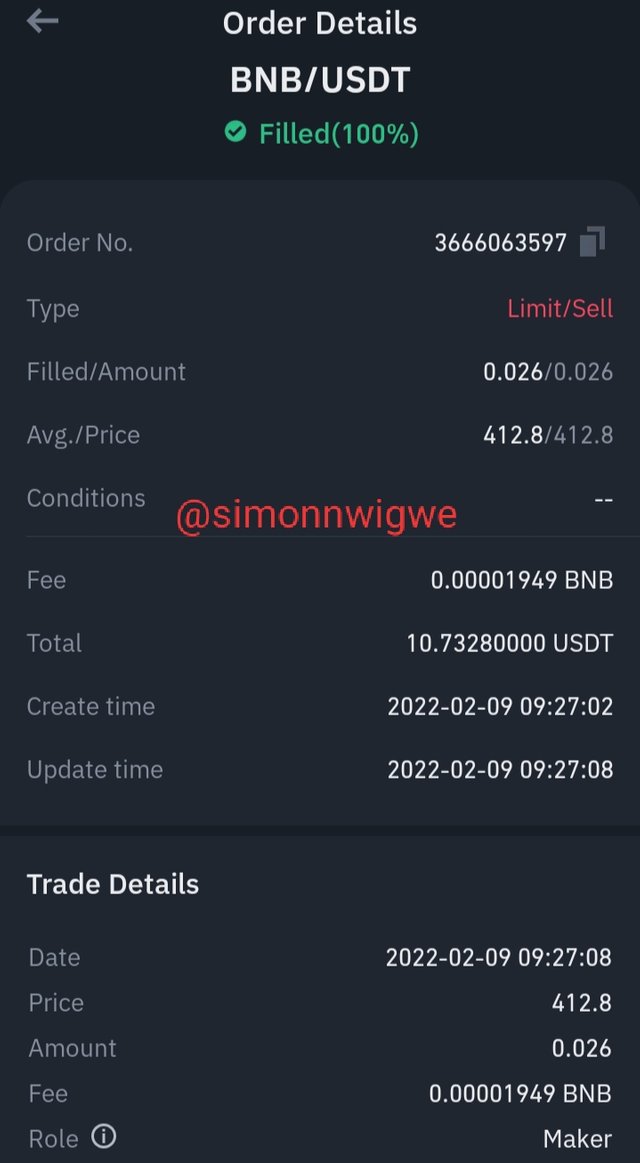
From the chart above, all the criteria listed above are taken into consideration. The EMA line is above the price, the parabolic Sar indicator dot just started above the price and the RSI is seen above the 50 threshold level. This is a clear confirmation of a sell signal hence I took my entry at that point. Here is the screenshot of my executed transaction on binance exchange.
Conclusion
As we have explained earlier, leverage trading is indeed a type of trading that is profitable and at the same time it is very risky. When the price moves in the direction of the trader, there is high tendency of making a very large amount of profit within the shortest possible time but on the other hand, if the trade goes against the prediction of the trader, they account of the trader may be liquidated if he/she does not deposit an amount to cover the losses.
I want to sincerely appreciate the professor in the person of
@reddileep for such a wonderful lecture. I have really learnt a lot at the cause of performing this task.