Demo trades of XRPUSDT on a 4H time frame using Stochastic RSI Indicator
Hello guys,
I welcome you all to my blog today. It's a new day in the trading world and I'm delighted to be your host once again in this journey and career which most of you have taken to free yourself from financial freedom.
Recently I decided to always perform a live analysis on the market and possibly enter a demo trade to show you all how my strategies work. I believe a lot of you have gained a little knowledge about my strategies so far.
In this post today, I will be taking into consideration a pair of XRPUSDT on a 4H timeframe and then analysing it using the Stochastic RSI Indicator as we did in our previous lecture.
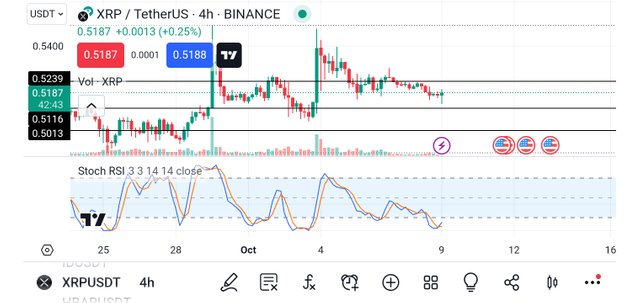
From the above screenshot, you will notice that the asset has hit it's an oversold region as I explained in my previous post. Once this region is hit, all we need is to search for a long possible entry position.
You can also see that the price was rejected at the support level thereby creating a long bottom wick, so all we need is to allow the 4Hcandle to close bullish as we have seen all the signal that implies that the market will be going in an upward direction.
We are not going to enter the trade immediately because the 4H candle has not closed but we have a clear signal from the indicator already as the blue line has crossed and is trending above the orange 🍊 line as you can see in the screenshot below.
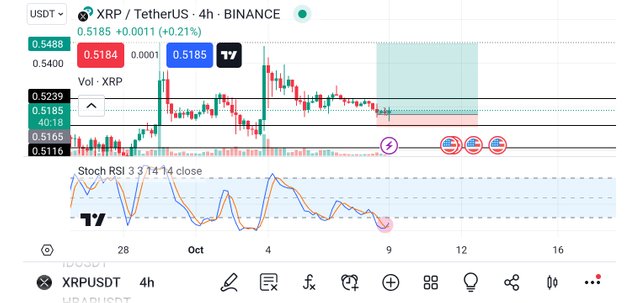
We need a confluence confirmation and that is the reason we must wait for the 4H candle to close bullish before jumping into the trade. I have put on the buy signal logo as you can see in the image above with a risk-reward ratio of about 2:20.
Immediately the 4H candle closes bullish, it is expected that we enter and long the market and then set our first TP1 in the next resistance level the second TP2 in the next resistance level and so on.
I'm currently waiting for the closure to enter the market and if you are reading this post before the closure of the 4H candle, then I advise you to check and be sure that the candle closed bullish and then enter the trade be it a demo or real trade because I'm certain about this analysis.
If you have any questions or contributions, please do well to use the comment section of this post and I promise to attend to you ASAP. Thank you and until we meet again in my next publications.
Disclaimer: This post is made as an education and not investment advice. Digital asset prices are subject to change. All forms of crypto investment have a high risk. I am not a financial advisor, before jumping to any conclusions in this matter please do your research and consult a financial advisor.
Thank you, friend!


I'm @steem.history, who is steem witness.
Thank you for witnessvoting for me.
please click it!
(Go to https://steemit.com/~witnesses and type fbslo at the bottom of the page)
The weight is reduced because of the lack of Voting Power. If you vote for me as a witness, you can get my little vote.
Upvoted! Thank you for supporting witness @jswit.
This is a well done analysis on xrpusdt, Thanks for sharing with us 😊👍
This is a great article of xrpusdt.
Thanks for sharing this important content.
Beautiful analysis on the price of xrp, indeed the stochastic rsi is a good indicator and helps in price analysis.