Analyzing and Demo Trading of WAVESUSDT using the Support & Resistance Strategy

Background Image Edited on Canvas
Hi friends,
I remain your favorite crypto analyst in the person of @simonnwigwe from Nigeria 🇳🇬 and it is a great pleasure on my part to share with you all the analysis I did today on a new pair of crypto assets called the WAVESUSDT.
Market analysis is becoming part of as I continue to check through and analyzing the market almost on daily basis. Today I also checked through my whitelist and I saw this very pair and I decided to see how far I can analyse it.
Just like previous posts, I will also be using the support and resistance method to carry out this very analysis today. Support level are level where the market stop without going down further whereas resistance level are level where the price stop without going up further.
This key points are very important in trading any crypto asset and they are the main point use for analysing the crypto asset. Based on that fact, let's look at the pair of WAVESUSDT using the said method.
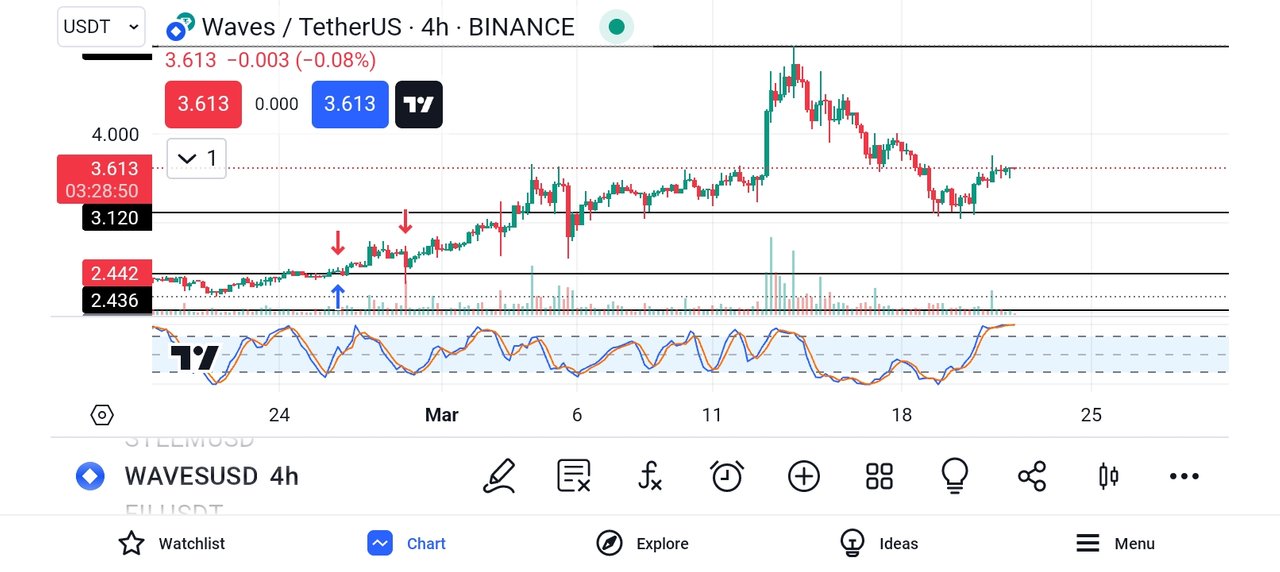
If you check through the chart above, you will notice that the levels of support and resistance has been drawn on the chart. This levels can be many in a single chart. So seeing that the level of support wasn't broken from the chart, I knew that the market will go upward again.
So I decided to watch the market closely and I noticed that price was rejected in the support level and that made the price to start going upward. So a good entry for the trade was all I waited. So after seeing the volume and the green candles forming I decided to introduce my buy logo as you can see from the screenshot below

From the chart above, you can see that we have introduce the buy logo which shows the level of profit and loss I'm willing to make in this trade. From the chart, you can see that the take profit is seen at the next resistance level whereas the stop loss is just below the last bearish candle which is above the support level.
From the analysis the risk management or risk reward ratio if the analysis is around 2:10 which is a good trade if you ask me. So confirm and see how far this analysis will go we will move a step ahead that is by demo trading the market.
To properly keep track of the progress of the said pair of assets, I decided to introduce a demo trade to at least keep me on track and in check so that I will have a little emotion when the market goes in my favor or against me. See the screenshot below.

From the above screenshot, you will notice that the demo trade has been activated already. If the market goes as predicted, then I will be able to earn a total of 68.70 USD, and if the market goes against me for any reason I will lose 12.00 USD. This shows that it's a good risk-reward ratio if you ask me.
Finally, I also decided to go to the position side to get complete information on the market so that you all can see it more clearly. The details below talk about the points where I take my profit, my stop loss, and even the current price of the asset when I'm making the post.

From the screenshot above, you will notice that the side is long (buy), the quantity is 50, the average fill price is 3.606, the take profit level is at 4.980, the stop loss is at 3.366 and lastly the P&L at the moment is +0.05, that is all about the open order.
After a while, I decided to check back on the trade to see if the market was going in my favor or against me. Going through the chart I saw that the market did not respected my analysis and that is what gave us the result you can see from the screenshot below.
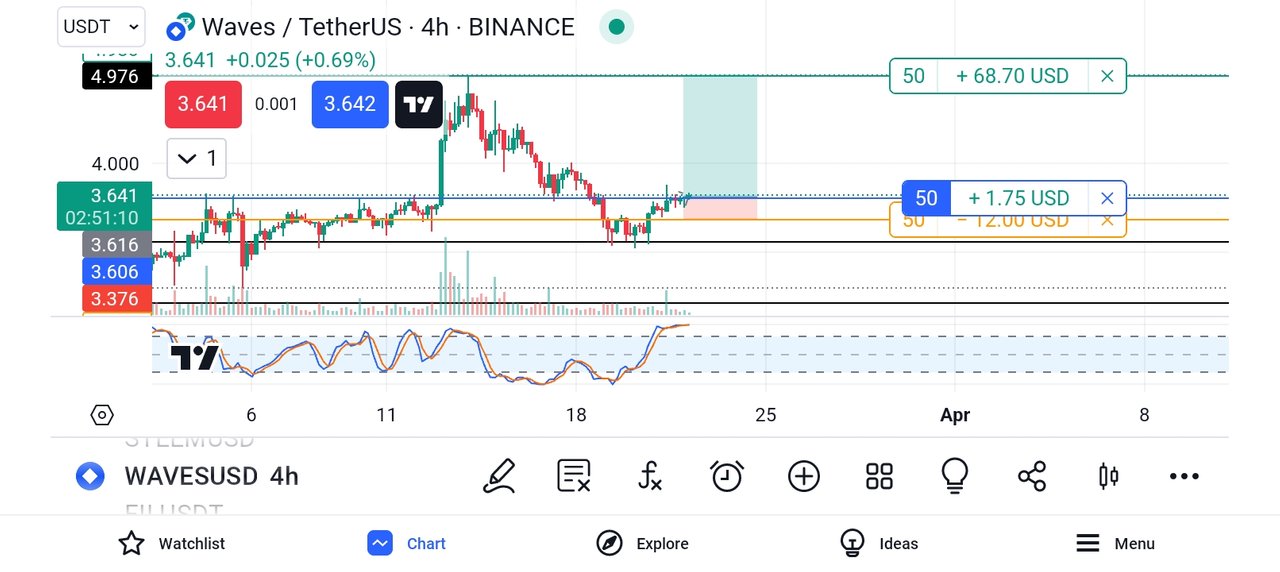
From the above screenshot, you will notice that the profit made is already at +1.75 USD which means our analysis is in my favour at the moment. I will still hold on to the market and see the final movement of the asset because I'm confident that it will go my direction. So let's be patient as market will still go as predicted.
Conclusion
When analysing a crypto asset, what you need is to check the historical movement of the asset and in doing so means you should check the support and the resistance level of the asset also check the volume of the asset, those elements will help you predict more accurately.
We have seen from the analysis how we are able to use this strategy effective to make some profit trading the pair of WAVESUSDT. We continue to practice until we improve greatly on this trade of ours.
Remember also that trading is like meditation, patience is the key. Always wait for the market to come to you and not for you to go to the market. Learn to identify your key support and resistance level and also trade with the trend and in that way, you will be a successful trader.
Finally, I want to thank you all for reading through my post today. If you have any questions or contributions, please do well to use the comment section of this post. See you all in my next publication.
Disclaimer: This post is made as an education and not investment advice. Digital asset prices are subject to change. All forms of crypto investment have a high risk. I am not a financial advisor, before jumping to any conclusions in this matter please do your research and consult a financial advisor.
NB: All images except otherwise stated are mine and taken from tradingview.com website
X-Share
You've got a free upvote from witness fuli.
Peace & Love!
Note:- ✅
Regards,
@jueco