[Crypto Trading With Chaikin Money Flow Indicator]- Crypto Academy S4W6 - Homework Post for professor @kouba01

Hello everyone, it is a great pleasure to partake in this week’s crypto homework task with our noble professor @kouba01. I must say that this is another wonderful and exiting lecture for this week and I really loved the topic chosen for the week Let us set the ball rolling by delving to the subject matter.

Question 1
In your own words, give a simplified explanation of the CMF indicator with an example of how to calculate its value?
All indicators we know are mostly always averaged-volume indicators and their motive of creation is always giving an indication to an entry or exit point in the market of any crypto asset.
The CMF also meaning Chaikin Money Flow was created in the year 1980s as one of the technical indicators in the crypto market by Marc Chaikin. This was created purposely to give measurement to money flow volume for a specified timeframe. This indicator upon creation has a feature that is able to determine whether there is a buying pressure or a selling pressure in the market.
The principle working mechanism is that, for closing price always moving close to the high, the we can confirm an accumulation and when the closing price seems closer to the low, then we can confirm a distribution. What we should know is that, accumulation in crypto could also be a buy entry and distribution could also be a sell position.
This indicator (CMF) also performs functions like detecting and confirming the strength of trends and also it being able to identify potential trend breakouts and reversal is also another major factor about the indicator.
The indicator works on a calibration of +/- 0.2. This means that we have a portion of negative values and for non-negative values.
When ever we realize that the CMF indicator is above the + 0.2-line, t end it would signal a buy entry meaning there is an uptrend in the market or a bullish period.
But A case where we see the CMF indicator moving below the 0.2 giving as negative values, it is considered to be a sell position. At this point, the trader must sell his or her assets in other not to make loses.
I would now like to talk about the calculation of the CMF indicator.
This can be done by calculating the MFM (Money flow Multiplier) where the formula is
MFM= [(Close price - Low price) - (High price - Close price)] / (High - Low)
You will then find the MFM through multiplying the MFM to its associated volume
MFV = MFM × Volume Period
We can now find our MFM, the math equation is
MFM = [(Cprice - Lprice) - (Hprice - Cprice)] / (Hprice - Lprice)
Where:
Lprice = Low price for the day
Cprice = Close price for the day
Hprice = High Price for the day
Lets look at this example: Assuming under a period of 20 days, BTC/USDT was observed and the following statistics has been given for us to calculate the value of the CMF.
Hprice = $ 56,859.90
Cprice = $ 56, 825.01
Lprice = $ 56,558.00
Period Volume = $ 43,553.00
Total Period Volume = $41,356,163,560
In other to find CMF we will have to find MFM first.
MFM= [(Close price - Low price) - (High price - Close price)] / (High - Low)
MFM = [(56, 825.01 - 56,558.00) – (56,859.90 - 56, 825.01)] / 56,859.90 - 56,558.00
MFM = -1
We find the MFM next,
MFV = -1 x 43,553.00
MFV = - 43, 553.00
Now we can find our CMF
CMF = - 43, 553.00 / 41,356,163,560
CMF = -1.053119928 X10^6
This is equivalent to 0.00
Question 2
Demonstrate how to add the indicator to the chart on a platform other than the tradingview, highlighting how to modify the settings of the period(best setting).(screenshot required)
In this chapter, I would be adding the CMF indicator to a pair of crypto charts of my choice. I will be explained how to add the indicator to a chart systematically and also how the settings are modified.
I would like to perform this task using the official website of Good crypto. It has versions like android and also the IOS. But I would be using the web version for this task.
The first thing I do is to visit the site through official -website. Once it loads, you then select the web app version to proceed.

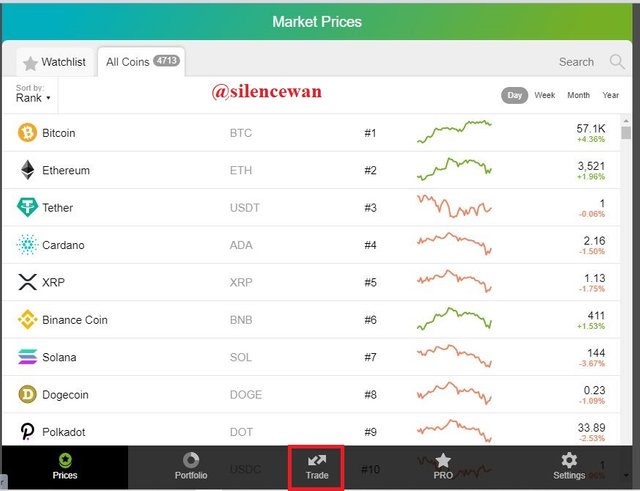
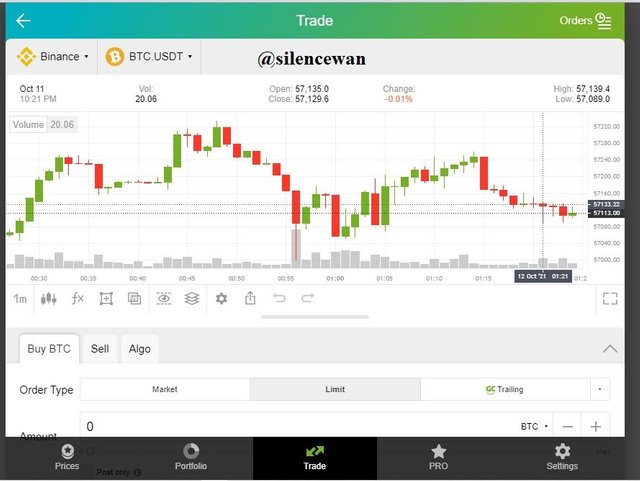
The next stage is to select the trading side of it, this will aid you to have access to the trading platform where we will be adding our indicator to the chart.
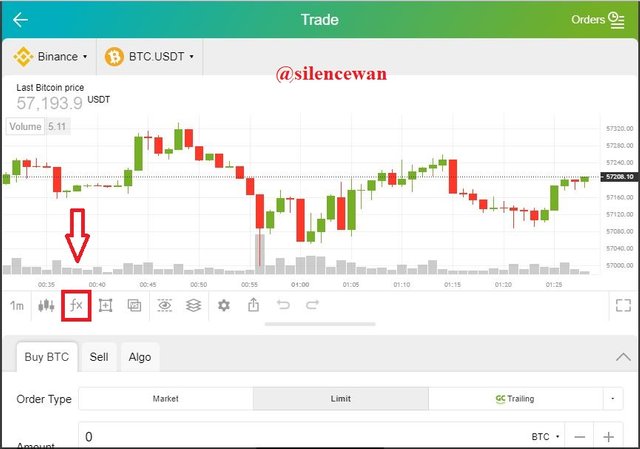
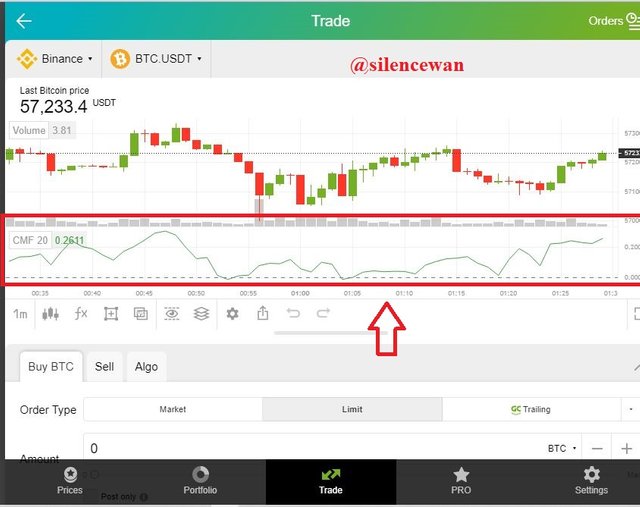
The next thing to do is to Fx which represents the indicators.
Search through the list of indicators and then select the Chaikin Money Flow Indicator
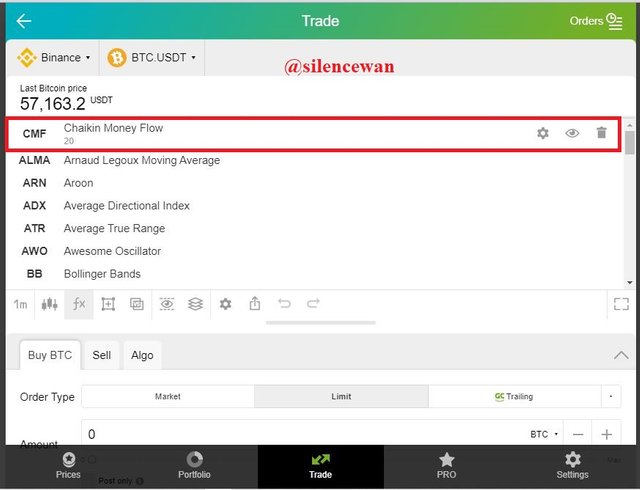
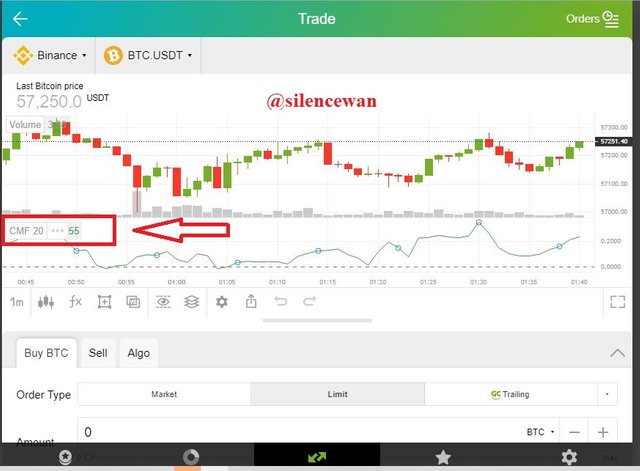
You can now see that, our indicator has been added successfully to our chart.
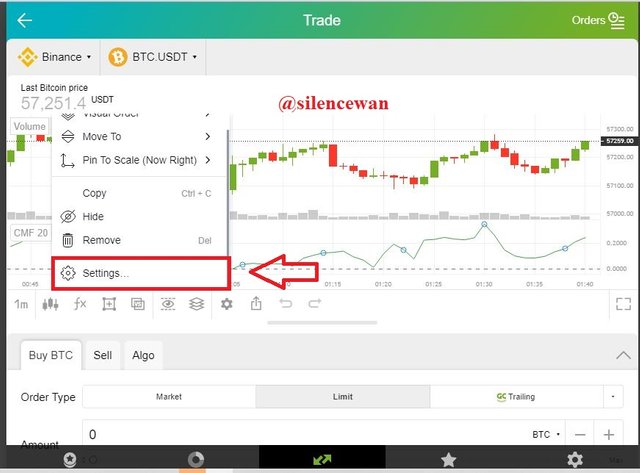
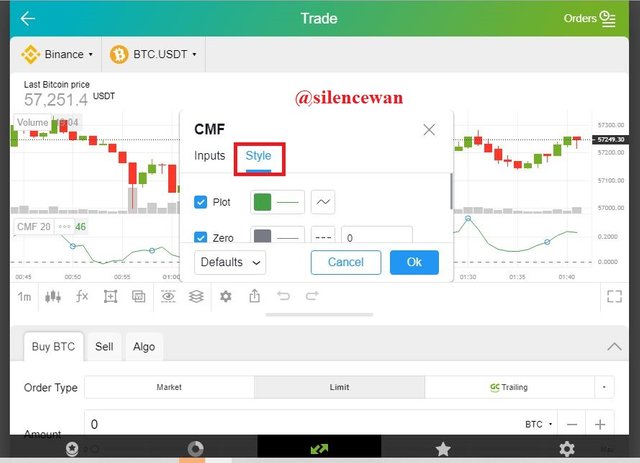
Modifying the settings of CMF on Goodcrypto
In other to make any modifications, you will have to click on indicator name and select settings.
What you will have t do next is, setting up the length which could also mean the period.
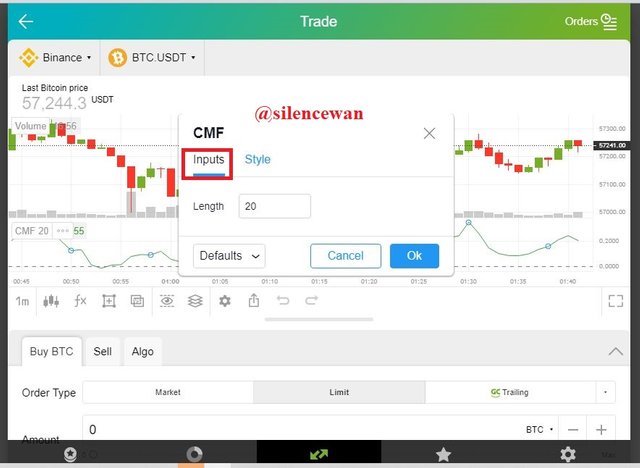
Also, you can make changes with regard to the style of the indicator. This involves the zero and plot of the indicator.
Best CMF Indicator Settings
In every trading strategy involving the usage of indicators, the creators of this indicators had already run several testings to get a specific setting that could best fit the indicator which was developed by Marc Chaikin and his default settings for the period were either 20 or 21. Specific was 21 but some traders fall within the range of 20 and so on.
But it is always advisable to combine indicators to have good trades as there are more volatilities in the market. All traders have a different mindset of going into trades. We have some that deal in short-term trades which will require different use of indicators and those into long-term trading. So basically, this solely depends on the trader.
Question 3
What is the indicator’s role in confirming the direction of the trend and determining entry and exit points (buy/sell)؟(screenshot required)
The idea of the indicator is based on the fact that whenever we realize a closing price getting close to the high then it confirms accumulation and also when we realize that the closing price is getting closer to the low then we can confirm a distribution. The motive of the indicator is to confirm trends that occurs in the market and also most importantly, measuring of the strength, identifying potential trends and lastly, it also plays the role of confirming trend reversals and trend breakouts.
Here there are two values we consider when using the indicator, these are the +1 and that of -1. When the positive values are seen, this will indicate a sign of an uptrend therefor the price off the asset should be moving upwards giving us a bullish trend or bullish season.
But when we notice that the values are in negatives, then we can confirm a downtrend or a bearish season of the price of the asset or in the market. For bearish season, the price of the assets goes down same us the indicator.
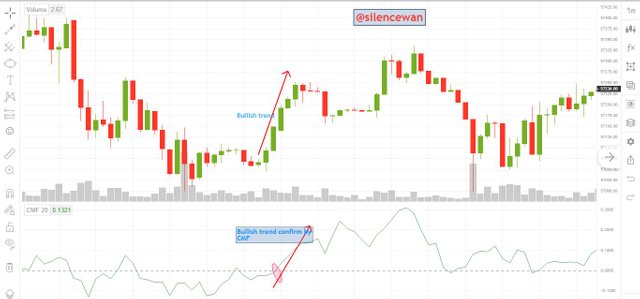
I have made some illustrations to confirm what I explained practically. You can see in the chart below; the price of the asset went high. But since we are using the CMF indicator and we know how the readings are calibrated, we would be able to know what kind of trend we dealing with. Now, we see that the line of the CMF indicator went above the 0-midpoint line breaking through a bullish trend. It went towards the positive values which surely gives an uptrend.
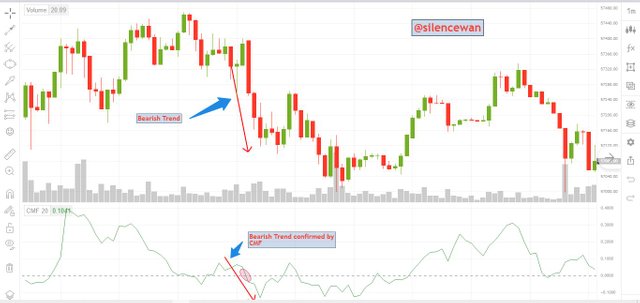
Below in this chart, we can also see the other way round of the calibration. We know that whenever the line of the indicator moves in the negative direction, thus below the 0-midpoint, then we can say that it is in a bearish trend. So you can see that the indicators line is in the negatives which gives as a downtrend hence a bearish season.
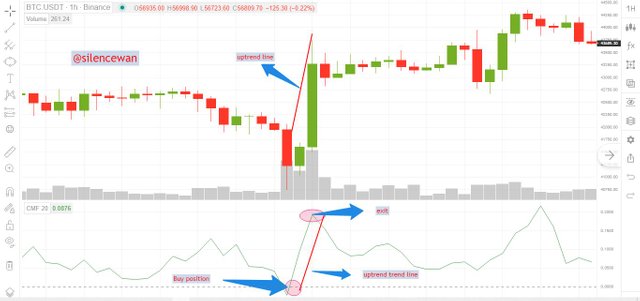
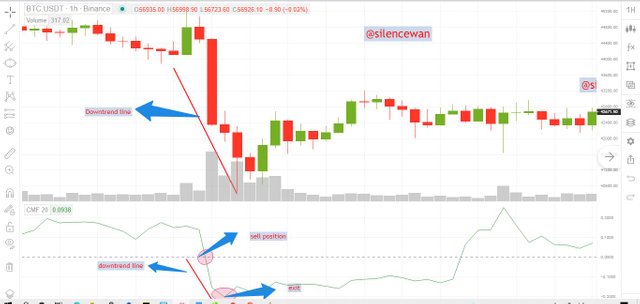
1. Buy Entry and Exit Points
In the chart below, I will be using the BTC/USDTC pair, which I made my analysis on for a buy position or entry. I use a time of 1H. Now you can see clearly by the indicator on 26th September 2021, the indicator went above the 0-midpoint line which gave an uptrend. So us a trader when you observe this, you should be ready to place you buy position so to make profit. Because you know that when we are in the bull period then the price goes up which gives profit. Now you should also know when to exit a trade in other not to lose. You can see that the price went up to its peak and there was a sharp fall, there a trader who is interesting in making profits should quickly exit the trade.
2. Sell Entry and Exit Points
In the second part which is the sell position, I used the same crypto pair and the same timeframes. On the 24th of September, you realized that the price had gone down below the 0-midpoint line, so basically, as a trader you should know that when its gets beyond this line using this indicator you must place the sell position in other not to lose. Also, you should know when to exit the sell position. Cause when you see that the price is trying to go up, then you have to prepare to exit a sell position and the prepare to make a buy entry cause its possible prices might go up.
Question 4
Trade with a crossover signal between the CMF and wider lines such as +/- 0.1 or +/- 0.15 or it can also be +/- 0.2, identify the most important signals that can be extracted using several examples. (screenshot required)
In this chapter, we have been taxed to make a crossover between the signals of the CMF indicators and its lines, lines such as the +/-0.1, +/-0.15 or +/-0.2
Crossover is not a big deal in the trading strategy, what this implies is, is just another form of detecting trend movement. But in this chapter, we have been taxed to pick two values, for the first, thus + 0.1 and then -0.1 and or + 0.15 and – 0.15 or + 0.2 and – 0.2.
Assuming we pick +/- 0.1, this will imply that, when the line of the indicators goes above+ 0.1, it will imply an uptrend or a bullish trend which definitely is the buy position. But for the – 0.1, it will mean that the price of the asset is going as it gets below the predetermined mark. This will be a bearish trend or a sell position.
Let’s take charts below using the +/-0.1 and +/- 0.2 levels
Using +/- 0.1 on ETH/USDT
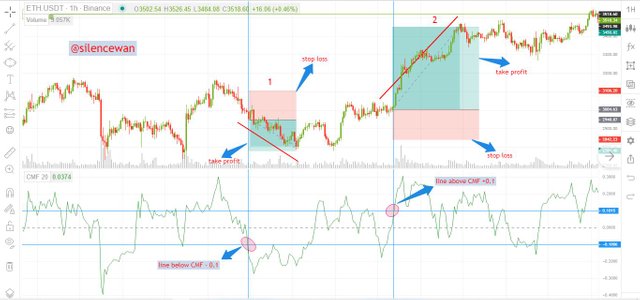
Now considering the chart of ETH/USDT above, I have been able to place a trade, thus either a buy or a sell using the crossover strategy as asked by the professor. Let us proceed to see how it is done.
Part1
For the first part which I labelled 1, we can clearly notice that, that is a sell position as we can see the line of the CMF going below the predetermined number set which is – 0.1. So, a trader will quickly place a sell position see the line going beyond – 0.1. As you can see in my chart, I placed my sell position.
Part 2
Now if you notice again, you can see clearly on the same chart, I placed my buy entry using the crossover strategy. You noticed that, the line of the CMF went above the set mark which is 0.1. And we also know that, when then line comes from the – 0.1 and then move above the + 0.1, it is a a bullish trend representing a buy entry which you can see that I placed my buy position in the chart above. I also set my stop lose and then take profit so to avoid loses.
Using +/- 0.2 on DOGE/USDT
From the above DOGEUSDT, I placed a buy and sell trade based on the CMF indicator crossover strategy. The part 1 and 2
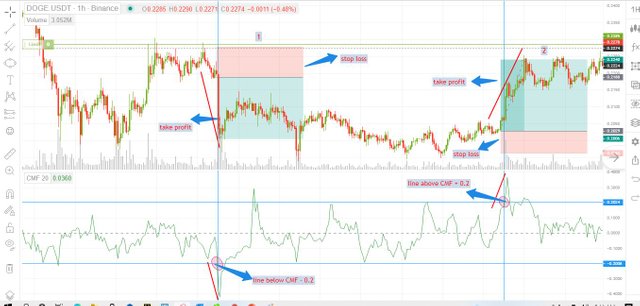
Part 1
This is just the same as in the case of the first part. +/- 0.1. but in this case, we shifted a little. I have decided to use +/- 0.2 as stated by the professor.
We have observed that, the line from above passed crossed the – 0.2 line. This we already know that it is a sell signal. So, in the chart above, I placed my sell position clearly shown I the chart. No trader will love to lose so you will definitely make you sell entry to avoid such.
I also made good use of my risk reward ration and then. I placed my stop loss and take profit accordingly as shown in the chart above.
Part 2
Here is the same old story, above from the – 0.2 through to 0.2 above it is an uptrend indicating a buy position. So I have placed my buy position as you can see in the chart above on part. As soon us I saw the line of the CMF moving above the mark of the 0.2, I placed my buy entry and you can also see clearly my stop lose and take profit.
conclusion
I would conclude by saying that, the crossover strategy for +/- 0.1 is quite okay to use, but we saw that, the price of the assets seemed closed. There was not much visibility within the price so sometimes you can you can make a decision but in actual fact it might be the opposite as there is not much space to see how the trend goes and looks like properly. But in the case of the +/ - 0.2, we can see that, the trade was placed us just the way I wanted it. You have the liberty to see how the trend looks like before
Question 5
How to trade with divergence between the CMF and the price line? Does this trading strategy produce false signals?(screenshot required)
Trading Trend Divergence and CMF Indicator
The idea of divergence occurs when price movement does not conform to the CMF indicator. Hat this simply means is that, for divergence to occur, then the price of the asset will move differently from the CMF indicator and mostly, this happens as a result of trend reversals “quick and early trend reversals” This is what causes divergence to occur.
Bullish Divergence of CMF Indicator
In the bullish divergence of the CMF, there is always a possibility of an upside reversal about taking place. This mostly happens when price of the assets falls with regards to the low but in actual fact, the CMF indicator does not follow suit as a result of a lower reading.
So basically, the indicator goes up while the price of the asset comes down. Let’s consider the illustration below.
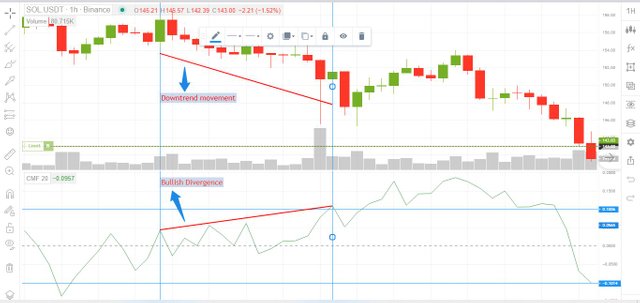
In the chart of SOL/USDT above, we can confirm a Bullish divergence as the line of the indicator was found moving upwards whiles price of the asset is going down. This doesn’t not give the correlation that is supposed to exist between them, so we confirm a bullish divergence.
Bearish Divergence of CMF Indicator
For a bearish divergence to occur, then the price of the asset mostly moves to a high but the indicator would fall in short. Meaning the indicator will not go higher this will therefore cause a bearish divergence in the market.
So, what happens is, when the two does not tally just like in the case of the Bullish trend, of the Bearish divergence, a bearish movement will follow the bullish movement in the market.
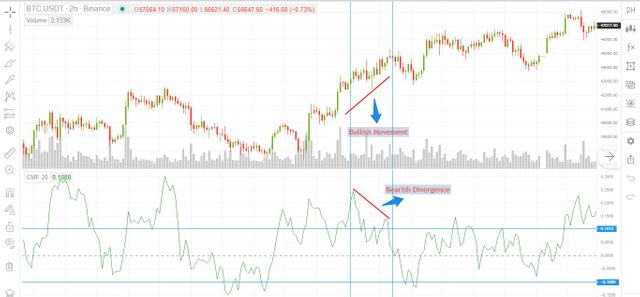
Looking at the chart of BTC/USDT above I confirmed a bearish divergence when I realized these factors. I saw that the price of the asset gave a bullish movement while the CMF indicator moved differently confirming a bearish divergence.
False CMF Indicator Signals
I will state emphatically that, there has not been an indicator yet created that does not produce false signals. All indicators I have come across so far at least has one or two lags. The CMF indicator is a great one a good to use for trading. But to be on the safer side, it is always advisable to pair indicators to yield best result. This indicator can be paired wilt the EMA which will help traders do a great job and help reduce some of these false signals.
For the case of the Bullish divergence and Bearish divergence, these are all false signals that are being produced most at times. So, the best indicator to use always is to pair indicators.
It is always great and interesting participating in your work professor @kouba01. These indicators really play a major role in trading activities. The CMF indicator is a great indicator and I was really happy and excited to learn it as it was simplified by the professor.
But like I said, although the indicator is great and good to use, but it is always advisable to merge or pair with other to get the best result when trading.
Thanks for the work…..!!!!
Hello @silencewan,
Thank you for participating in the 6th Week Crypto Course in its 4th season and for your efforts to complete the suggested tasks, you deserve a Total|8.75/10 rating, according to the following scale:
My review :
Although you have provided a series of information in your explanation of the CMF indicator, it lacks a clear methodology.
You gave a clear example but it is not correct where you have to provide the results of the previous period 19 to get the result of the period 20. It was possible to add your opinion on the result obtained.
Chaikins suggests 21 days as the default setting. That corresponds approximately to a trading month. If the number of periods is larger, the indicator is less volatile and less prone to sideways movements. In a weekly or monthly chart, the number of periods should be reduced.
The rest of the answers were at a good level in terms of explanation and depth of analysis.
Thanks again for your effort, and we look forward to reading your next work.
Sincerely,@kouba01
Thank you professor. I’m always glad to partake in your works. I’ll take note about all said next time.