Understanding Trends II - Crypto Academy / S5W3- Homework Post for @reminiscence01


In the world of cryptocurrency, we only have two types of trends, That is the bullish trend and also the bullish trend. In the market for a bullish or bearish trend to occur it usually relies on the individual conducting the market at the moment. In most time the market is always in a bullish trend whenever the buyers are conducting the market whiles the market is always bearish whenever the sellers are conducting the market. Whenever there is progress in trend direction.
The commanding party cannot be able to change the cost or price to be in their approval, Also the cost or price is conquered in the facing party, With this, we have reversal to take place and also we have the trend reversal to be in either bullish to a bearish reversal on market, When we take this into account the bullish trend will tend to be a bearish trend on market whiles a bearish to a bullish trend, With this, the bearish trend will happen to be bullish in the market.
Usually, the bull's power always decreases in time of a bullish to a bearish reversal on market, This is going to make the bears conquer the bulls, They are always in charge of bringing the market descending. Normally the bearish to the bullish reversal, We have the bears to give up rules to the bulls, That is also in charge of bringing the assets higher on the market.
Whenever it comes to the world of cryptocurrency trading, Newbies and some amateur normally have difficulty trying to allocate negative signals on market. Some traders use different types of technical indicators in allocating negative signals on the market which is not fully reliable, Usually in the world of cryptocurrency users with more knowledge are always conducting the cost of the stock for users with less knowledge to start trading. So users must join two or more indicators in other to get accurate results to prevent negative signals before they enter into trading.
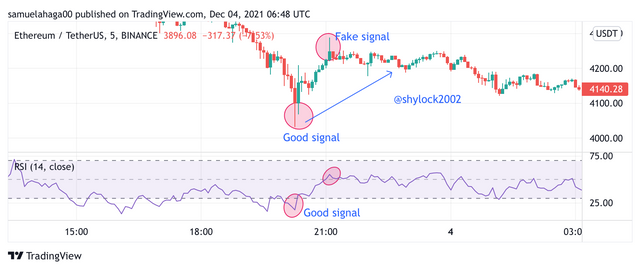
In addition, Each time a trader enters the market and whenever there is a reversal signal on market, It is also advisable for traders to relax in other to get an understanding of the trend split, This is going to help prevent negative signals on the market. The newbies and some amateurs usually make some errors on the market when it comes to trading, They usually begin their trading whenever there is a reversal on the market which normally results in bluff. Most of the time the people of most coins on market always conduct the chart in other for a trend to have a look of reversal, Due to the look of this is usually recalls the attention of newbies and some amateur traders with less knowledge to begin their trading. Newbies and some amateur traders can help prevent this negative signal when they join two or more indicators to get accurate trend signals and also whenever there is a reversal signal on market, It is also advisable for traders to relax in other to get an understanding of the trend split
In the world of cryptocurrency trading, The market structure is usually created on the chart in a form of bearish or bullish movements of the market price. Also with the market structure, all the costs on market would be gathering to be in a bearish or bullish trend direction on market.
When we talk about the market structure for a bullish trend. This usually consists of higher high and high low. In the market each time the price of a stock goes in an uptrend, That is in a zig-zag style on the market chart, With this, we can clearly say the market is in a bullish trend direction. Also when it comes to the bullish market structure we have the cost of a stock to move at a high cost and it has its cost of the stock to be decreased at a low cost. Each time it happens this way the price then turnaround, That is the price will be higher more than the old opposition height. The market structure is always in a bullish trends whenever the chart extends to gives a higher highs and higher lows.
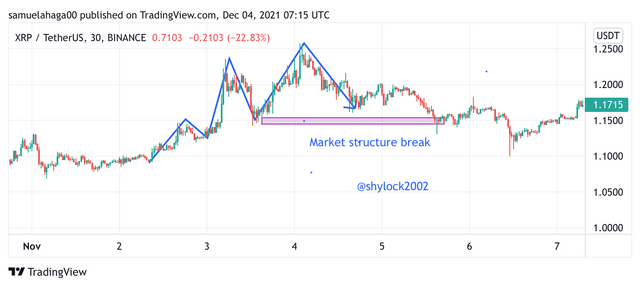
Usually when there is a split in the market structure of a bullish trend, This makes the market decline in creating higher highs and higher lows in previous trend on the market. With this, we are going to have a trend reversal on market, Since there is a split in our bullish market structure.
When we talk about the market structure for a bearish trend. This usually consists of lower lows and lower highs. In the market each time the price of a stock goes in a downtrend, That is in a zig-zag style on the market chart, With this, we can clearly say the market is in a bearish trend direction. Also when it comes to the bearish market structure we have the cost of a stock decline and increases slightly high on the market. Each time it happens this way the price then turnaround, That is the price will be lower more than the old backing height. The market structure is always in bearish trends whenever the chart extends to give a lower low and lower high.
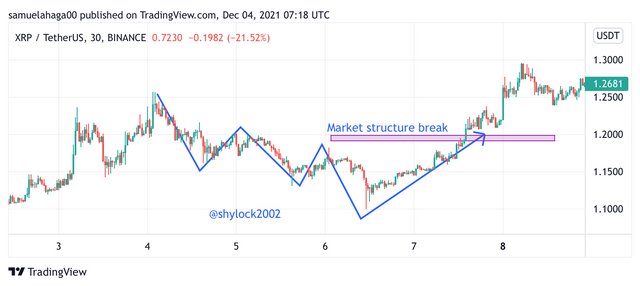
Usually when there is a split in the market structure of a bearish trend, This makes the market decline in creating lower lows and lower highs in previous trend on the market. With this, we are going to have a split in our bearish market structure resulting in our trend to be bullish trend reversal on market.
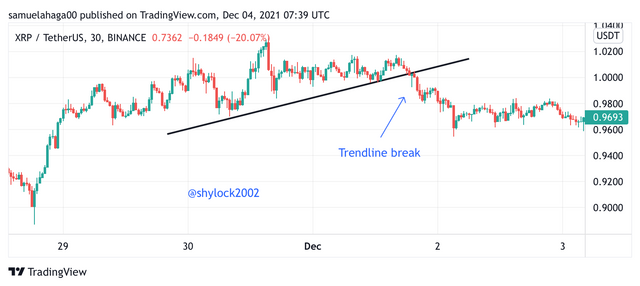
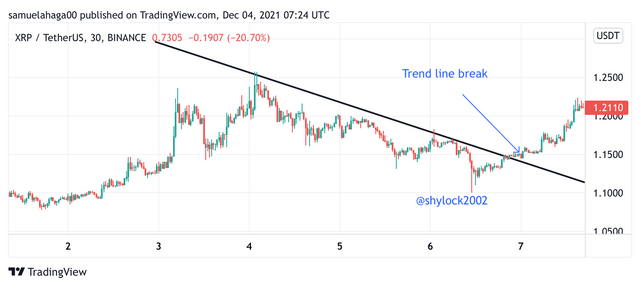
When we put the the bullish trend line on board, It is usually when the trendline on the market chart associate not less than one higher low stroke on the market chart. This is telling us that uptrend trendline is usually having an affair along with the market structure of an uptrend. We also have the bullish trendline to serves as a backing each time the cost on market jump outside anytime the cost on the market touches the line on the market chart. So with this in other for the bullish trendline to split, The cost on the market must decline to jump outside the trendline in the market yet splitting the line on market and this is going to help result in a bearish trends reversal on the market.
When we put the bearish trend line on board, It is usually when the trendline on the market chart associate not less than one lower high stroke on the market chart. This is telling us that bearish trendline is usually having an affair along the market structure. We also have the bearish trendline to serves as a protection each time the cost on market jump outside anytime the cost on the market touches the line on the market chart. So with this in other for the bearish trendline to split, The cost on the market must decline to jump outside the trendline in the market yet splitting the line on market and this is going to help result in bullish trends reversal on the market.
When we take a good look at divergence it very identical to the technical indicators, That is they have some things in common. Each time a trader examine a chart utilizing the technical indicators, It is always the wish of all traders for their technical indicators to be going, That is succeeding their price trend in the market. Not all the time this happens on the market, Some times the cost of a stock on market and the traders technical indicator will perchance be going in a facing direction on the market. Let see something here, The cost on market will go in a bullish trend while the trader technical indicator perchance will go in a bearish trend at the some time on market.
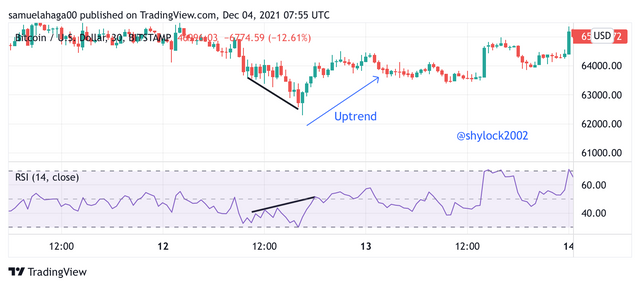
Now let take a look to bullish divergence, In bullish divergence we always have the cost of stock on the market to be going in a bearish trend on market and also we have our technical indicator to be going in a bullish trend on market at the same time. thereafter trend development on the market, We will be having the fee of the stock to rapidly invalidate in the bullish trend and this is going to result in a bullish divergence on the market chart.
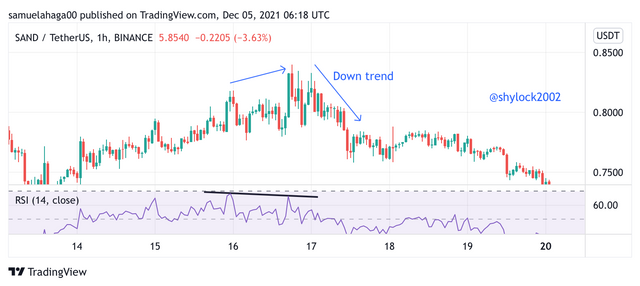
Now let take a look to bearish divergence, In bearish divergence we always have the cost of stock on the market to be going in a bullish trend on market and also we have our technical indicator to be going in a bearish trend on market at the same time. thereafter trend development on the market, We will be having the fee of the stock will rapidly invalidate in the bearish trend and this is going to result in a bearish divergence on the market chart.
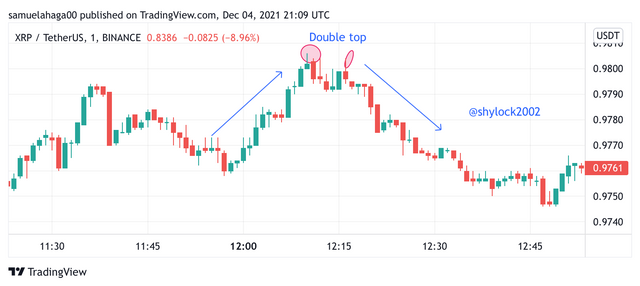
Double tops.
The double tops are known to be one of the greatly technique which is very identical to all traders in the world of crypto trading. Usually when it comes to the double tops we have expense of a stock to be creating an early broad of a consecutive bullish trend in the market. Each time we have our trend to get to the peak, This will make the price in the market to create a quick reversal within the bearish path, This will then jump behind also to the last price high on the market. M shape is always formed at the leading of the market chart, Whenever the expense on the market creates a powerful trend turnaround in the bearish path on the market chart.
We also have the next height to be fulfilling the point of price reversal. Usually when traders start to encounter liquidity in the market, Most traders utilize this opportunity to trade their assets in the wallet, In other to make enough profit while the expense on market was unable to go an additional upwards in the market chart.
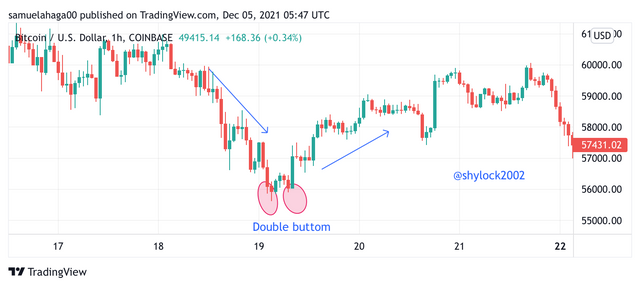
Double buttom.
The double buttom is also having some similar functions to the double top, Usually when it comes to the double button we have expense of a stock to be creating an early broad of a consecutive bearish trend in the market. Each time we have our trend to get to the peak, This will make the price in the market to create a quick reversal within the bullish path, This will then jump behind also to the last price low on the market. W shape is always formed buttom toward the underside of the market chart, Whenever the expense on the market creates a powerful trend turnaround in the bullish path on the market chart.
We also have the next low to be fulfilling the point of price reversal. Usually when traders start to encounter liquidity in the market, Most traders utilize this opportunity to purchase enough assets into their wallet, In other to make enough profit while the expense on market was unable to go an additional downwards in the market chart.
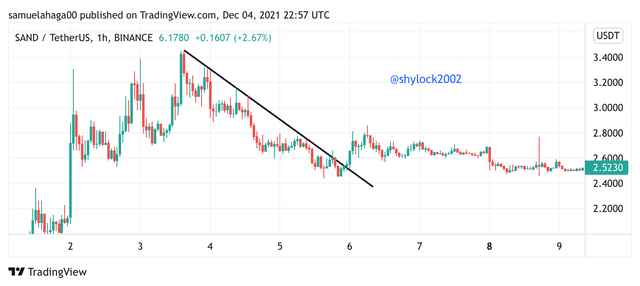
When you have a good look at my 1hr SAND/TETHERUS of my chart, You can also have a look to my chart that my trend line structure on the market chart was split and I was able to get my trend reversal. The price on my market chart was creating a high low on the chart, Whiles it was creating a high low, With this analysis tells us that the bears is currently managing the market as the time I performed this task, From my chart it is showing a bearish to the bullish reversal was known to be created on the market chart.
Well done brother keep it up
🙏😊
@steemcurator02