Crypto Trading Strategy with Triangular Moving Average (TRIMA) Indicator - Crypto Academy / S6W4 - Homework Post for @fredquantum.
Hello everyone. Hope you all are doing good. I welcome you all in another week of sixth season. This week, the professor @kouba01 has taught us about the "
Crypto Trading Strategy with Triangular Moving Average (TRIMA) Indicator
". This is my homework task.
.png)
Question 1. What is your understanding of the TRIMA indicator?
The crypto market is highly versatile where the price of the coins are not stables and keep changing time to time. The traders keep doing the trading and their buying and selling pressure effect the movement of the market. The market behave according to the moves of the traders in the market. So the traders first analyze the market before taking the trading decision. There are multiple tools and strategies and the indicators are use to analyze the market to predict the future of the market.
Moving average indicator is a technical based indicator which is very popular among trader in crypto world. This is very commonly used technical indicator to identify the market trend. But this indicator has the lagging nature. It mostly depend on the past data of the coin. The past data is use to determine the present data. Because of having lagging nature, many other types of the MA are being introduced to overcome this lagging problem. Many advanced version of MA has been introduced in the market with most advance capabilities like WMA, EMA, triple EMA, EMA, etc. Another type of the moving average is Triangular Moving average.
The Triangular moving average is very useful moving average indicator which is use in crypto market to analyze the market trend. This indicator helps the traders to identify the market trend so that they can decide what to do next in the market. This indicator similar to Smooth moving average which is use to find out the average value of the past data while its line move along with movement of price on the chart. The past data of the coin is use to calculate the average value in the SMA.
Triangular moving average follow same principle. It also use the past data and then calculate the average value of coin for present but difference is that the Triangular moving average indicator calculate the average value for twice. The SMA calculate the average value of closing price for once but the triangular moving average calculate the average value of closing price for twice.
Because of calculating the average value for twice, it is also known as the double SMA. It does not react to price fastly. It is more smooth as compare to the SMA. This produce signals which helps the traders to identify the market trend more clearly and authentically. This indicator also not react to the high volatility which has been raised from the fundamental news in the crypto market.
Key Points of Triangular Moving Average Indicator
- This is the technical indicator use to identify the market trend.
- It calculate the average value of closing price for twice. So it is more smooth in its result.
- It produce more clear representation of the market trend. The traders can easily determine the market trend using Triangular moving average.
- This indicator do not react on the high volatility market which are raised by getting impacted from fundamental news.
- It produce more authentic results with high accuracy and effectiveness when we combine it with other indicators.
2. Setup a crypto chart with TRIMA. How is the calculation of TRIMA done? Give an illustration. (Screenshots required).
First of all, go to the tradingview.com. Visit the chart section. Select chart of your own choice and click on the indicator icon.
.png)
Search for Triangular Moving Average
.png)
Click on it and it will be added on your chart.
.png)
Its parameters setting can be change. For this, click on the setting icon and a new section will be appeared.
From here, one can change the setting according to his own requirement and need.
.png)
.png)
- Calculations of TRIMA
Triangular moving average is also known as the double smooth moving average. So to calculate the value of TRIMA, first we need to find out the value of SMA.
- SMA = (P1 + P2 + P3 +.. + Pn)/no. of period
Where
- P= price of first period
- P2= price of second period
.
.
.
- Pn = Price of last period
Now we can calculate the value of TRIAMA using the following formula.
TRIMA = (SMA1 + SMA2 + SMA3 + SMA4 + SMA 5.... .. + SMAn)/no. of period into consideration
Let assume we have to calculate the TRIMA of below chart.
.png)
First we calculate the SMA where n=3.
- SMA = (P1 + P2 + P3)/3
P1 = $0.853
P2 = $0.852
P3 = $0.849
SMA 1= (0.853 + 0.853+ 0.849)/3
SMA 1= 0.851
SMA 2= (0.848 +0.845 +0.844)/3
SMA 2 = 0.845
SMA 3= (0.848+0.845 +0.846)/3
SMA3 = 0.846
TRIMA =(SMA1 + SMA2 + SMA3)/3
TRIMA = (0.851 + 0.845 +0.846)/3
TRIMA = 0.8473
Question 3. Identify uptrend and downtrend market conditions using TRIMA on separate charts.
Identification of Uptrend with TRIMA Indicator
There are a lot of trend based technical indicator which helps the trader to determine the market trend. There are uptrend downtrend and sideway phase in the market. To identify these market phases, trader can use the technical indicator and get the market trend signals. But while using the indicators, one should be very careful about the length setting of the indicator because it effect the performance and out put of the indicator a lot. SO trader should be very careful about which length of indicator would be more suitable to identify the market trend in different situations. For example, short length is not good to identify the uptrend. So traders should have proper knowledge about uses of the indicator in order to get full advantages out of it.
Using the TRIMA, the traders can identify whether the market is trending upward or downward. It has only one line which oscillate with movement of price. When the price of coin is moving above the line of TRIMA, it indicate that there is uptrend in the market. This give us the bullish signals. The price is moving above the line mean price is rising. There are the higher highs and lower lows. But each high is higher than previous high. There is bullish trend so traders can make the buy entry.
.png)
Downtrend Identification Using TRIMA
Another trend in the market is downtrend or bearish trend. When the price of coin is moving below the line of TRIMA, it indicate that there is downtrend in the market. This give us the bearish signals. The price is moving below the line mean price is declining. There are the lower low and lower highs. But each low is lower than previous low. There is bearish trend so traders can make the sell entry.
.png)
Question 4. With your knowledge of dynamic support and resistance, show TRIMA acting like one. And show TRIMA movement in a consolidating market. (Screenshots required).
There is a phase in the market when the price do not have a perticular direction. There is no clear trend but price keep moving between a ranging zone. At this time, the TRIMA act as the support and resistance. This happen when the price keep bouncing back between two zones; resistance and support. The price keep moving and this show struggle of the buyers and seelers. Sellers and buyers have same potential. One push the market upward but when price reach to resistance level, sellers bounce back the price downward and it continue until the price break the support or resistance level.
In the below screen short, the coin is moving upward. The coin is making higher highs and high lows where each high is higher than previous high. The trend is ver clear. coin is moving above the TRIMA line which indicate that the is bullish trend. The TRIMA line act here as support level. When after a retracement or formation of higher high, the price bounce back during retracement. When it hit the TRIMA line, it bounce back upward and another higher high is formed. SO here, the TRIMA line is acting as a dynamic support which curbing the price to move below and thus uptrend is continue.
In the below image, the TRIMA acting as the dynamic resistance line. The price is moving below the TRIMA line which indicate that there is downtrend in the market. The coin is forming the lower low and lower highs where each low is lower than previous low. AFter each impulsive wave, the coin form a retracement and move up to form the low high. When it hit the dynamic resistance which is TRIMA line here, the coin again start trending downward and another lower low is formed. This lower low is lower than previous low and thus trend continue. Then a point come when coin stop forming the lower low more lower than previous low.
There is another phase of market which is known as the ranging phase when the direction of the coin is not clear. There is no particular trend in the market. In this case, the TRIMA line keep moving above or below the price but there is no particular market trend. This continue to happen until and unless the sellers or buyers come in high potential and drag the coin toward a particular direction.
.png)
Question 5. Combine two TRIMAs and indicate how to identify buy/sell positions through crossovers. Note: Use another period combination other than the one used in the lecture, explain your choice of the period. (Screenshots required).
This indicator do not react to price quickly. So traders cannot rely holysolely on this indicator. But they should combine TRIMA with some other indicator in order to get the more authentic and best trading signals. They will get the appropriate trading spots.
In the below screen short, i have set the time frame for 2 hours. I have added he two TRIMAS in order to get the most authentic and quick buy and sell signals. The length of first TRIMA is 20 and the Length of second TRIMA is 30. These both indicators will give me more clear signals to identify the market trend.
When the short period TRIMA cross the long period TRIMA and started moving above, it indicate that there is bullish trend. This cross section produce the buy signals for the traders. Traders should enter into the market when the short length TRIMA cross the long period TRIMA.
.png)
To place the sell order, we need to reverse above strategy. When the long period TRIMA cross the short period TRIMA and started moving above, it indicate that there is bearish trend. This cross section produce the sell signals for the traders. Traders should exit into the market when the long length TRIMA cross the short period TRIMA.
.png)
Question 6. What are the conditions that must be satisfied to trade reversals using TRIMA combining RSI? Show the chart analysis. What other momentum indicators can be used to confirm TRIMA crossovers? Show examples on the chart. (Screenshots required)
- Guidelines for Trading Bullish reversal
Add two TRIMA on the chart. One length should be low like 22. The others length should be high as 30.
First trend should be bullish in the market.
Then wait for the small TRIMA to cross the long TRIMA and start moving above. This indicate that the buyers are in control and market is trending upward. This crossover indicate the trend reversal from bearish to bullish
Then wait for the two to three bullish candles formation after this crossover. Then place the buy order.
Place the take profit and stop lose, then execute the buy order.
.png)
In the above screen short, the market was in bearish trend. We added two TRIMA, one for short length and other in long length. Now wait for the short TRIMA to cross the long TRIMA. When the short TRIMA cross the long and start moving upward, it indicate that there is uptrend. The bearish trend has been reversed into the bullish and after confirmation of bullish and formation of the bullish candles, we will place the buye order.
Add two TRIMA on the chart. One length should be low like 22. The others length should be high as 30
First coin should be in bullish trend.
Then wait for the long TRIMA to cross the short TRIMA and start moving above. This indicate that the sellers are in control and market is trending downward. This crossover indicate the trend reversal from bullish to bearish.
Then wait for the two to three bearish candles formation after this crossover. Then place the sell order.
Place the take profit and stop lose, then execute the sell order.
.png)
In the above screen short, the market was in bullish trend. We added two TRIMA, one for short length and other in long length. Now wait for the Long TRIMA to cross the short TRIMA. When the Long TRIMA cross the short and start moving upward, it indicate that there is downtrend. The bullish trend has been reversed into the bearish and after confirmation of bearish and formation of the bearish candles, we will place the sell order.
- RSI and TEMA Indicator
RSI is a momentum based technical indicator which is use in the crypto market by the traders for analysis of the market. This indicator has 100 levels within which, it oscillate. When the RSI move below the 30 level, it indicate that the market is in oversold zone and selling pressure is high. The market price is decreasing and is in bearish trend. At this point, the bullish trend is expected. This is consider best spot to enter into the market. When the RSI move above the 70 level, it indicate that the market is in overbought zone and buying pressure is high. The market price is increasing and is in bullish trend. At this point, the bearish trend is expected. This is consider best selling spot.
For making a trading decision, both indicator should produce the same buy/sell signals at the same time. For the uptrend, The RSI should be below the 30 bands and should be in oversold region. The TRIMA should also be considered. For bullish, the short length TRIMA should cross the long TRIMA and start moving upward. This indicate that the bearish trend has been changed into bullish trend. When the both conditions fulfill, we can place the buy order.
In the above chart, the price was in downtrend. The RSI was below the 30 bands which indicate that market is in oversold region. Then we added the Two TRIMA with short and long length. When short length TRIMA cross long length TRIMA and start moving upward, it indicate that there is bullish trend. The trend have been reversed so we can place the buy order.
For the downtrend, The RSI should be above the 70 bands and should be in overbought region. The TRIMA should also be considered. For bearish, the long length TRIMA should cross the short TRIMA and start moving upward. This indicate that the bullish trend has been changed into bearish trend. When the both conditions fulfill, we can place the sell order.
In the above chart, the price was in uptrend. The RSI was above the 70 bands which indicate that market is in overbought region. Then we added the Two TRIMA with short and long length. When long length TRIMA cross short length TRIMA and start moving downward, it indicate that there is bearish trend. The trend have been reversed so we can place the sell order.
Question 7 - Place a Demo and Real trade using the TRIMA reversal trading strategy (combine RSI). Ideally, bullish and bearish reversals. Utilize lower time frames with proper risk management. (Screenshots required).
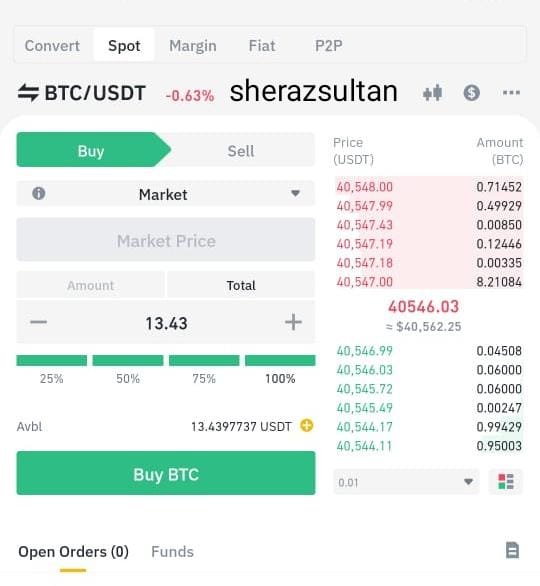
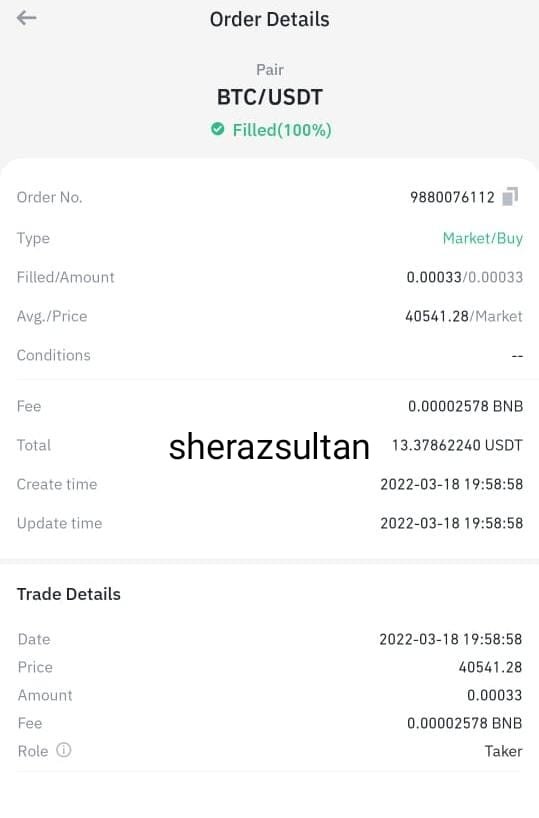
- Demo Trade (BUY Trade)
In the above chart, the price was in downtrend. The RSI was below the 30 bands which indicate that market is in oversold region. it produce the buy signals. Then we added the Two TRIMA with short 20 and long length 50. When short length TRIMA cross long length TRIMA and start moving upward, it indicate that there is bullish trend. The trend have been reversed so we can place the buy order.
.png)
When both condition got fulfill, i will place the stop lose and take profit and then will execute the order.
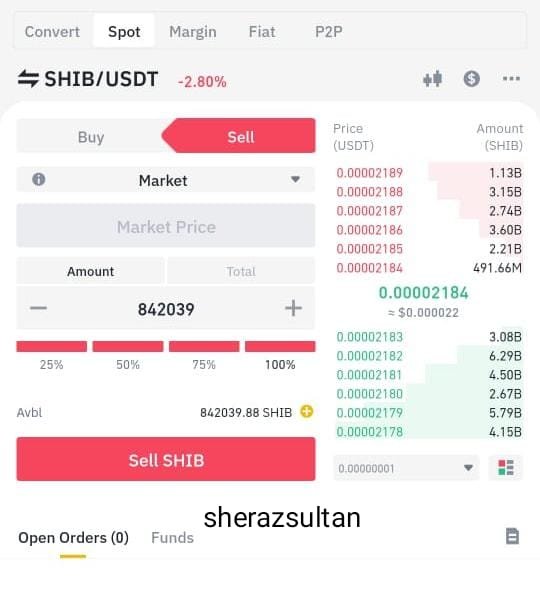
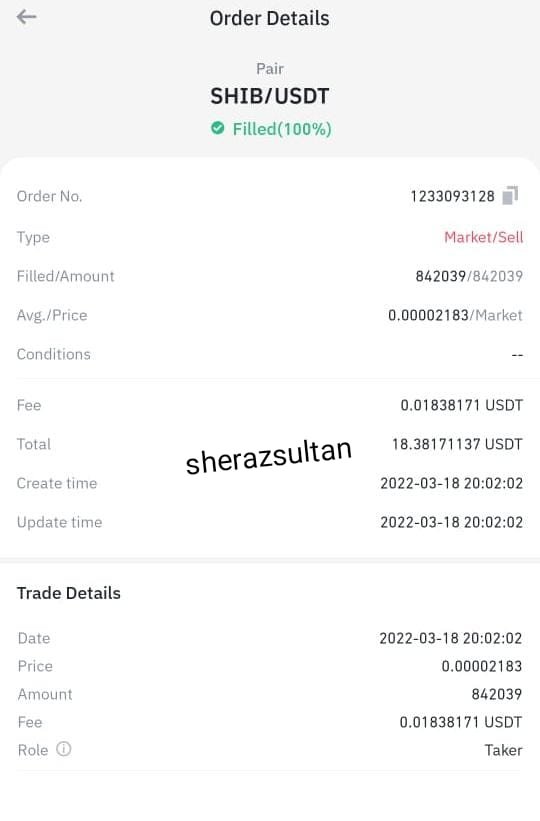
2- Real Trade (SELL Trade)
In the below screen short, The RSI is above the 70 bands and is in overbought region. The TRIMA should also be considered. For bearish, the long length TRIMA should cross the short TRIMA and start moving upward. This indicate that the bullish trend has been changed into bearish trend. When the both conditions fulfill, we can place the sell order.
.png)
In the above chart, the price was in uptrend. The RSI was above the 70 bands which indicate that market is in overbought region. Then we added the Two TRIMA with short 20 and long 50 length. When long length TRIMA cross short length TRIMA and start moving downward, it indicate that there is bearish trend. The trend have been reversed so we can place the sell order. I placed the stop lose and take profit and execute the order.
Question 8 . What are the advantages and disadvantages of TRIMA Indicator?
Advantages of TRIMA
- It calculate the average value of closing price for twice. So it is more smooth in its result.
- TRIMA give the clear representation. So it remove the noise.
- It produce more clear representation of the market trend. The traders can easily determine the market trend using Triangular moving average.
- It produce more authentic results with high accuracy and effectiveness when we combine it with other indicators.
- The trend identification is so easy. When the price move above the TRIMA line, it indicate that there is uptrend. When the TRIMA line is above the price, it indicate that there is downtrend.
Disadvantages of TRIMA
- This indicator do not react on the high volatility market which are raised by getting impacted from fundamental news.
- It is only useful for trending market. When the ranging zone is place in the market, this indicator cannot helps the traders to get the accurate result
- To get more accurate results, we need to combine the TRIMA with some other indicator line RSI. Because it is also a technical indicator and no indicator alone can produce 100% accurate result.
- The TRIMA line act as the dynamic support and resistance which can be swapped because how fact it react to price.
- It also have the lagging nature. This indicator lag behind the price
Conclusion
The Triangular moving average is very useful moving average indicator which is use in crypto market to analyze the market trend. This indicator helps the traders to identify the market trend so that they can decide what to do next in the market. This indicator similar to Smooth moving average which is use to find out the average value of the past data while its line move along with movement of price on the chart. The past data of the coin is use to calculate the average value in the SMA. his is the technical indicator use to identify the market trend. It calculate the average value of closing price for twice. So it is more smooth in its result.
TRIMA give the clear representation. So it remove the noise. It produce more clear representation of the market trend. The traders can easily determine the market trend using Triangular moving average. It produce more authentic results with high accuracy and effectiveness when we combine it with other indicators. But we should be careful while using TRIMA because sometime it produce wrong result. It has the lagging nature. We should combine the TRIMA with some other indicator in order to get more authentic result.
Regard : @fredquantum