[CRYPTO TRADING STRATEGY WITH MEDIAN INDICATOR]- Steemit Crypto Academy- Homework post for Professor @abdu.navi03
Hello everyone. I welcome you all in another week of this protracted educational series. This week, respected professor @abdu.navi03 has taught us about "CRYPTO TRADING STRATEGY WITH MEDIAN INDICATOR
. This is my homework task.
.png)
Question 1. Explain your understanding with the median indicator.
The crypto market is highly versatile where the price of the coins are not stables and keep changing time to time. The traders keep doing the trading and their buying and selling pressure effect the movement of the market. The market behave according to the moves of the traders in the market. So the traders first analyze the market before taking the trading decision. There are multiple tools and strategies and the indicators are use to analyze the market to predict the future of the market. Some measure the momentum and strength of assets, some are use to determine market trend, some use to determine the future price, some use to identify the future trend, etc.
The Median indicator is very useful indicator which is use in the crypto market to analyze the market trend. This indicator is use to identify whether the market is trending upward or downward. The traders can identify the market direction and measure the market volatility at a specific time period using Median indicator.
This indicator is easy to use for trend determination. The indicator can also use to measure mean of high and low price of a coin in a specified period of time. There is a line which color is shown on the mid of indicator and use to identify whether the trend in bearish or bullish. When the line color is green, it indicate that there is bullish trend. When the line color is purple, it indicate that there is bearish trend. So line of color helps the traders to identify the market trend.
There is the upper band in color green and a lower band in purple color in the Median indicator. When price is rising upward and moving from down to top, the think line color turned into green. When the coin falling down, the think line color turned into purple.
Question 2. Parameters and Calculations of Median indicator. (Screenshot required)
- First of all, we need a chart to add he median indicator. So go to the tradgingview.com and open the chart section. Select chart of your own choice and then to apply median indicator, click on the indicator icon.
.png)
- Then search for the Median indicator and click on it.
.png)
- The median indicator will be added on to your chart.
.png)
- There is the different parameters of median indicator. There is a think line which is moving up or down with movement of price and its color is also changing with change in trend. There is an upper band in green and lower band in purple color.
- Now there are multiple parameters of median like upper band, lower band, Median EMA, median, median length, color etc. We can change these parameters according to our trading plan and setting. FOr this, click on the setting icon.
.png)
- In the input section, we will have the median length which is 3 by default. Then the ATR multiplier which value is 2 by default. This is use to calculate the upper and lower band of the median indicator.
.png)
- Then the style section. The upper band is the median upper band which act as the resistance level. Lower band or median lower band act as the support level/. Then the Median EMA which color is green when trending upward and purple when market trending downward.
.png)
Mathematical calculation
Below is the formula to calculate the median indicator.
- Median = (PH - PL)/2
PH = Highest price
PL is lowest price
Below are formulas to calculate upper and lower band
- Upper Median band = Median + 2 ATR
- Lower Median band = Median - 2 ATR
To calculate the EMA value, below formula is used.
- EMA value = (Cp x Multiplier) + {Previous EMA x (1 - Multiplier)}
where
- CP= Closing price
- EMA = Exponential moving average
Now median indicator calculation
- Median Indicator = ATR % change (Median , EMA)
Question 3. Uptrend from Median indicator (screenshot required)
Bullish trend is also known as the uptrend . When the price of the coin decrease in accumulation phase, the traders find it a good spot to buy coins. They They buy the coins at the low price. Because of high purchasing ratio, the demand get increase and supply ratio start decreasing. This cause an bullish trend occurrence in the market. In Bullish trend, the market is trending upward. The market movement is very clear.
The Median indicator can be use to identify the market trend. There is a median line and a median line. When the median line is above the EMA line, the trend is said to be the uptrend. At this time, the color of the median line turn into green and the line move from bottom to top in upward direction. This indicate that the coin price is rising and coin is trending upward.
.png)
In the above screen short, we can see that the median line turn into green when the median line is above the EMA line. This indicate that coin is rising and price is moving upward. This indicate the bullish trend. Traders can open the buy position at this spot when coin is riisng upward to earn profit.
Question 4. Downtrend from Median Indicator (screenshot required)
Bearish trend is also known as the downtrend. When the price of the coin rise in uptrend in the distribution phase , the traders find it a good spot to sell their coins. They sell their assets and earn the high profit. Because of high selling ratio, the demand get decrease and supply ratio start increasing. This cause an bearish trend occurrence in the market. In bearish trend, the market is trending downward.
The Median indicator can be use to identify the market trend. There is a median line and a median line. When the median line is below the EMA line, the trend is said to be the downtrend. At this time, the color of the median line turn into purple and the line move from top to bottom in downward direction. This indicate that the coin price is falling and coin is trending downward.
.png)
In the above screen short, we can see that the median line turn into purple when the median line is below the EMA line. This indicate that coin is falling and price is moving downward. This indicate the bearish trend. Traders can open the sell position at this spot when coin is falling downward to earn profit.
5. Identifying fake Signals with Median indicator(screenshot required)
The median indicator is very useful indicator which the traders use in the crypto market to identify the market trend. There are two basic trend in the market and traders can easily identify them using the median indicator. Not just this, this indicator use to measure the volatility. This indicator when combine with other indicators, work effectively to identify the false signals. The false signals are dangerous for the traders to make any trading decision. If the traders take a move using false signals, they have to face heavy lose. The Median indicator are very useful to identify the false signals easily. We can combine this indicator with other trend based indicator to get more effective and useful signals. These signals will be more accurate.
In the below screen short, we have added RSI and Median indicator. This indicator has 100 levels within which, it oscillate. When the RSI move below the 30 level, it indicate that the market is in oversold zone and selling pressure is high. The market price is decreasing and is in bearish trend. At this point, the bullish trend is expected. This is consider best spot to enter into the market. When the RSI move above the 70 level, it indicate that the market is in overbought zone and buying pressure is high. The market price is increasing and is in bullish trend. At this point, the bearish trend is expected. This is consider best selling spot.
.png)
I have added the RSI and median indicators to filter out false signals. In the below screen short, the RSI indicator has entered in the overbought region. This give us the sell signals and indicate that the trend is going to change in bearish. So traders should exit from the market. But we need to check the sell signals from the median indicator. The median indicator line is still green which indicating that there is still uptrend. This does not produce the sell signals. SO we should not exit from the market. This indicate that the RSI produce the wrong signals which we filtered out from the median indicator.
.png)
To place the order with more confidence at appropriate time, we need to check the both indicator. The both indicator must be producing the sell/buy order at the same time in order to place the buy/sell order.
Question 6. Open two demo trades, long and short, with the help of a median indicator or combination that includes a median indicator (screenshot required)
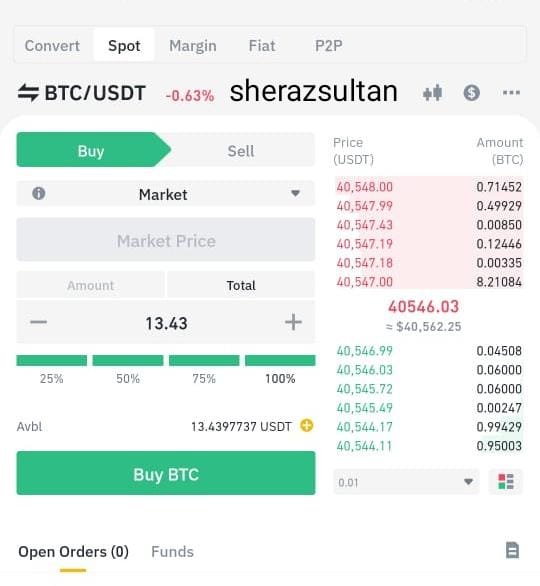
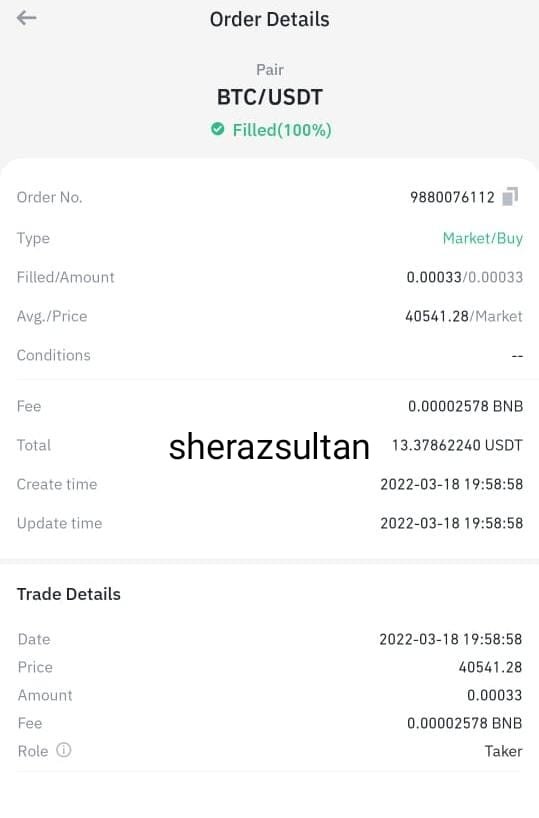
Buy Order
The below screen short is showing that the market is in downtrend. The market is trending downward while forming the lower low and lower high where each low was lower than previous low. The median line was also in purple color. This also indicating that the there is downtrend.
But then the coin take an opposite move and median line cross the Median EMA and start moving above. The Median line changed its color from purple to green which indicate that the bearish trend has been end and the bullish trend is going to start. So the traders can place the buy order at this spot. I have executed the buy order by placing the stop lose and take profit.
.png)
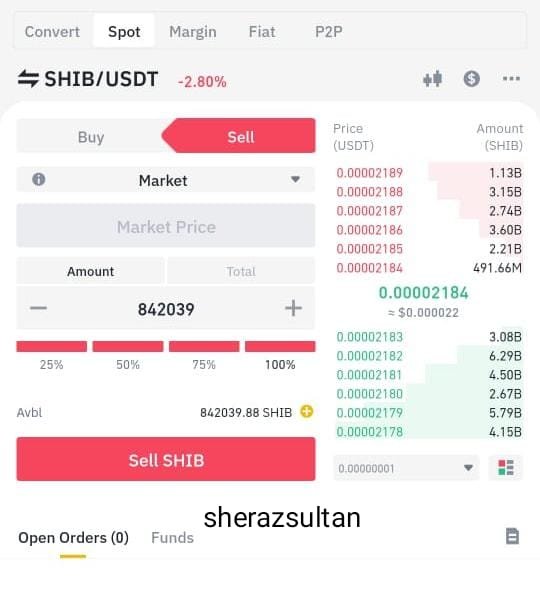
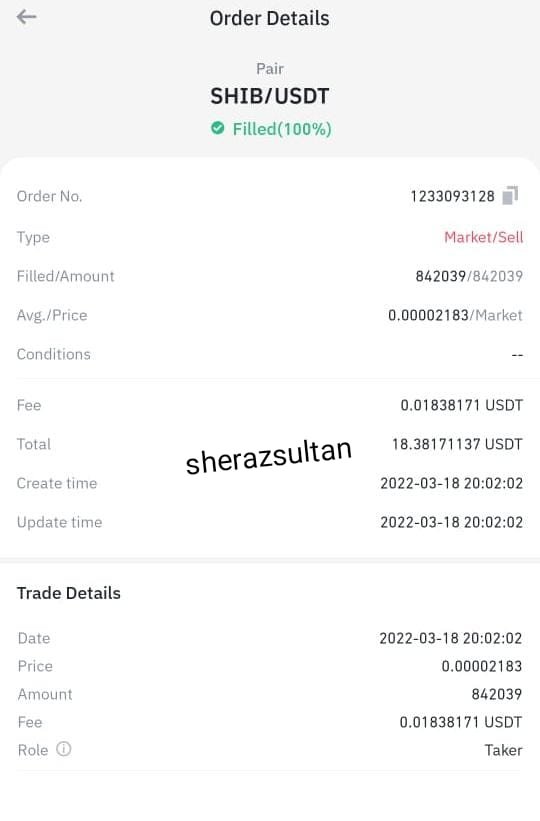
Sell Order
The below screen short is showing that the market is in uptrend. The market is trending upward while forming the higher high where each high was higher than previous high. The median line was also in green color. This also indicating that the there is uptrend.
But then the coin take an opposite move and median line cross the Median EMA and start moving downward. The Median line changed its color from green to purple which indicate that the has been end and bearish trend is going to start. So the traders can place the sell order at this spot. I have executed the sell order by placing the stop lose and take profit.
Conclusion
The Median indicator is very useful indicator which is use in the crypto market to analyze the market trend. This indicator is use to identify whether the market is trending upward or downward. The traders can identify the market direction and measure the market volatility at a specific time period using Median indicator.
This indicator also use to filter out the false signals. Thus traders can enter and exit the market at most appropriate time. When we combine this indicator with other trend based indicators, we get more accurate, authentic and effective output.
Regard : @abdu.navi03
Very well written. Keep up the good work!