REPOST - [ Crypto Trading by Identifying Support and Resistance ]-Steemit Crypto Academy | S6W3 | Homework Post for @shemul21
I'm reposting this Trading post as it was not curated. Here is the previous post.
.png)
Cover Image - https://www.canva.com/

QUESTION :-
1.- What is the Support & Resistance zone?
2.- Explain different types of Support & resistance with proper demonstration.
3.- Identify The False & Successful Breakouts. (demonstrate with screenshots)
4.- Use Volume and RSI Indicator Combined with Breakouts & Identify the Entry Point. (demonstrate with screenshots).
5.- Take a Real Trade(crypto pair) on Your Account After a Successful Breakout. (transaction screenshot required).
6.- Explain the Limitations of Support & Resistance (false breakout).
7.- Conclusion.

This is the Source of above image.
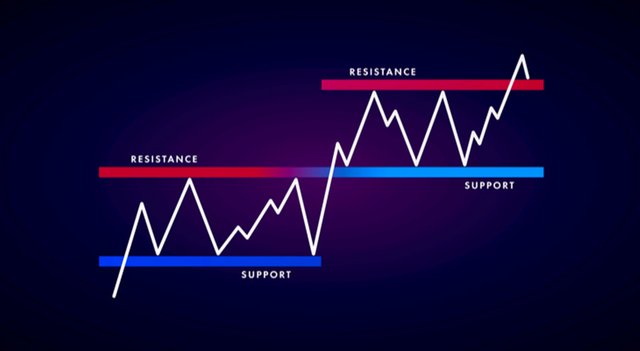
The support and resistance are two levels that can be seen on cryptocurrency price charts. They act as protectors of price exceeding the limits. These levels can be identified by imaginary lines drawn on a price chart.
The support level is located below the price movement when the price is continuously falling. The support level helps bounce the price and it stops further falling down of the price.
The resistance level is located above the price level. It is located in order to stop over rising of price and break it back.
Depending on the type of trade we plan to involve the support and resistance levels may vary their place. There are different ways that we can identify the support and resistance zones.
Historical price data is the most important way of finding the current support and resistance levels. Past information is helpful when predicting future price trends. That gives the trader the idea that which trade he should take.
The previous support and resistance levels are really important as there may be strong support and resistance levels in the past. So it is good to be alert about the previous zones which can be strong and maybe repetitive.
The technical indicators also help to identify the support and resistance levels. Some strong indicators provide signals for strong support and resistance zones. Traders should identify the indicator signals and enter into trades.
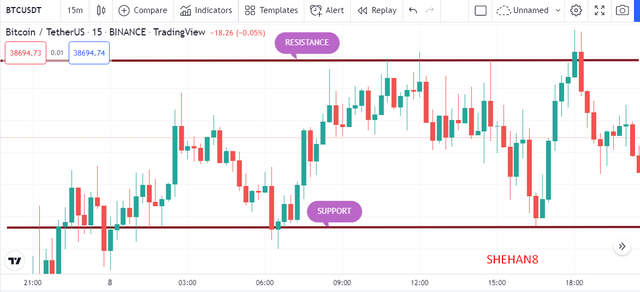
👉Horizontal support and resistance level
By taking a higher time frame we can easily see the horizontal support and resistance levels. The resistance levels are continuous so by the time being it becomes weaker and tends to a breakout. The same position has been identified as a support level after the breakout of the price. The traders can easily take the trading decisions by this type of support and resistance zones. When the existing level continues the price will again breakout. In this way with a longer time frame, we can identify the trend breakouts.
Screenshot - https://www.tradingview.com/
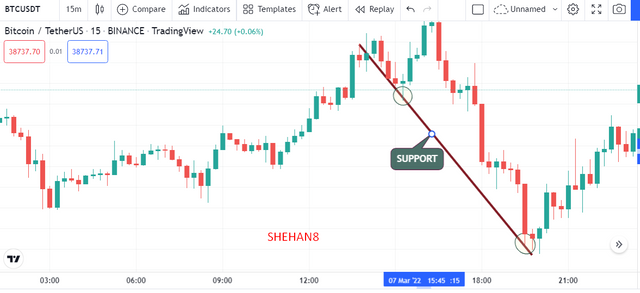
👉Sloping support and resistance level
Sloping support and resistance levels can be seen in many of the sloping price charts. We can see upward slopes and downward slopes in a price chart. The support and resistance zones in these sloping charts are identified by the trendlines. The upward support lines can be drawn once the price hits the higher highs which always are higher than the previous one.
When the market is in a downtrend the price goes down. The support and resistance are drawn to downward in that situation. Here the price hits the lower lows which is lower than the previous one. So the resistance line is drawn to downwards.
Screenshot - https://www.tradingview.com/
👉Dynamic support and resistance level
The dynamic support and resistance can be easily identified by using moving averages. These support and resistance levels undergo quick changes in price. As mentioned in the lecture, many traders like using 20, 50, 200 moving averages to get a clear idea of the trend. Strong price trends can be identified by using these three-time frames.
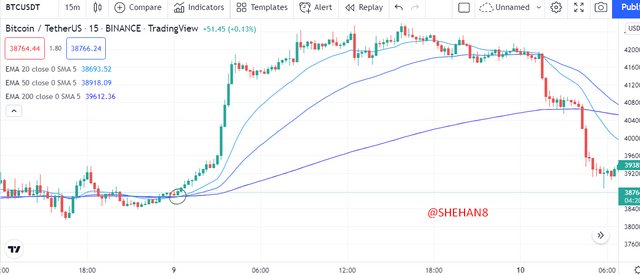
Screenshot - https://www.tradingview.com/
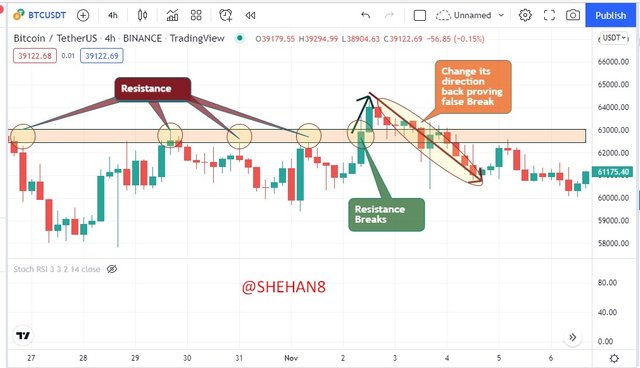
👉False Breakout
A false breakout occurs when the support and resistance levels signal a certain price trend and the price fails to keep its direction accordingly. The price moves exceed the support and resistance levels. This may help to make trading decisions.
Screenshot - https://www.tradingview.com/
In the above BTC/USDT chart I have identified a resistance area but as you can see the trend did not continue. It changes its direction giving a false signal.
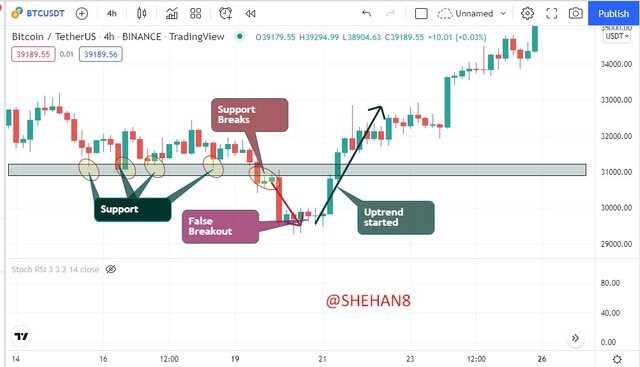
Screenshot - https://www.tradingview.com/
In the above BTC/USDT chart I have identified a support area but as you can see the trend did not continue. It changes its direction giving a false signal.
👉Successful Breakout
A successful breakout is when the support and resistance levels signals of a certain price trend and the price keep the trend direction accordingly. This helps traders to enter and exit trades successfully.

Screenshot - https://www.tradingview.com/
In the above BTC/USDT cryptocurrency chart I have Identified a support level. Here is a successful breakout that shows a pullback.
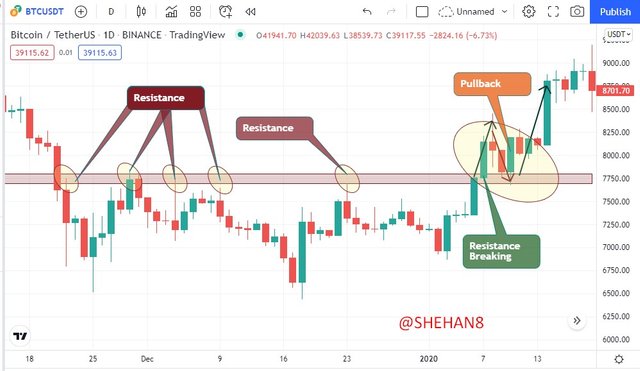
Screenshot - https://www.tradingview.com/
In the above BTC/USDT cryptocurrency chart I have Identified a resistance level. Here it is a successful breakout that shows a pullback.
The volume indicator shows the trend differences in a cryptocurrency chart. By observing that we can get the present trend of a crypto asset. The RSI indicator shows a smooth trend signal by observing the oversold and overbought positions. I'm going to take my trading decisions by observing the RSI indicator and the volume indicator.
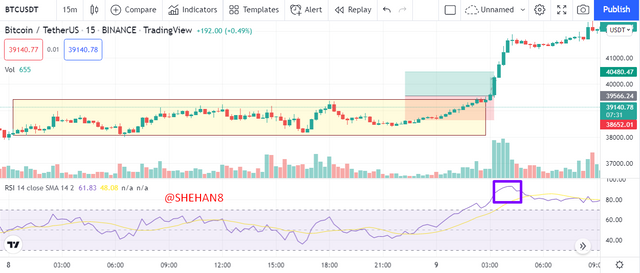
Screenshot - https://www.tradingview.com/
In the above screenshot of the BTC/USDT cryptocurrency pair, I have applied the volume and the RSI indicator to identify a buy position. Here I noticed the market structure breakout area. Then I marked the stop loss and take profit areas. The RSI indicator also denotes a level below 50 and that means I can take a buy decision.
These days, the Crypto Market is highlighy volatile and highly riskly as compared to the previous days. Because, theere are a lot of bad news in the Market as compared to good news. Therefore, I will use quite lower time framse and do a scalp Trading as I need to exit from the market quickly. Let's move to my real Trade chart analysis.
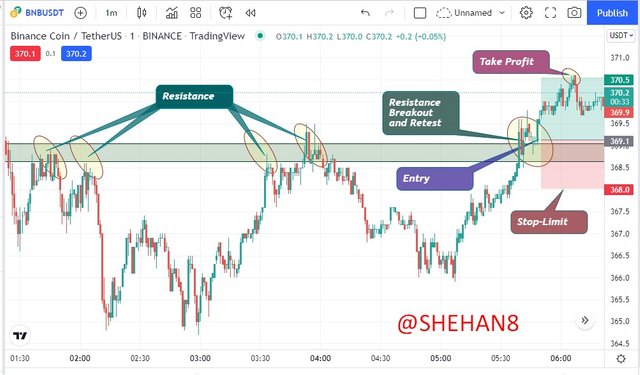
Screenshot - https://www.tradingview.com/
In the above chart, I have highlighted a proper resistance in my chart using BNB/USDT Cryptocurrency pair. So, here we can see the price has broken the above reistance zone with a good retest. Fiinally, I could take my entry at the highlighted entry point.
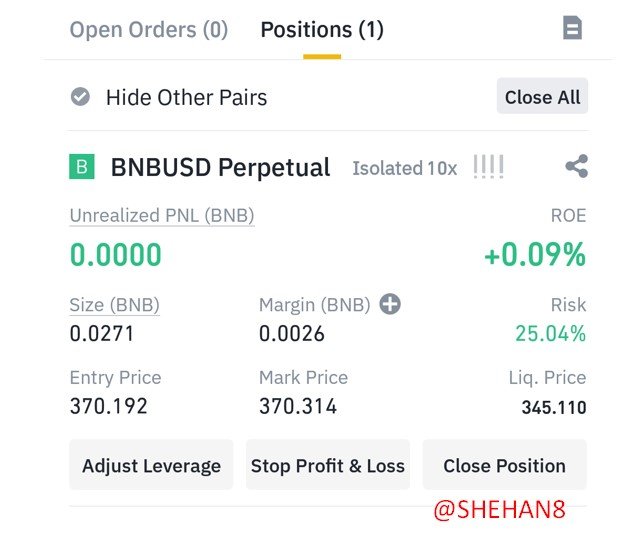
Screenshot - Binance Mobile App
In the above screenshot you can see I have done a real trade. I have placed a buy long order as you can see my order number. The average price in 370.192 which is the entry price. The maked price is 370.314. I have gained a small profit of 0.09%. Below I have attached the proof of my transaction details.
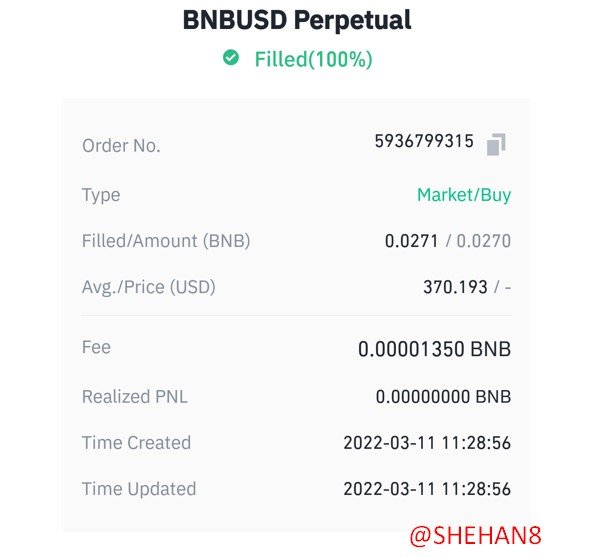
Screenshot - Binance Mobile App
The support and resistance levels do not provide true signals always. Sometimes the strength of candlesticks gets weak and the trend cannot be followed by the candles. So it gives false breakouts.
We should always wait till the confirmation of the breakout. It is good to wait and confirm the breakout and then take trading decisions.
Screenshot - https://www.tradingview.com/
The support and resistance lines are a very good way for all traders to use when entering and exiting trades. Traders should be well aware of the successful breakouts and false breakouts as the lack of knowledge of support and resistance levels may give traders a huge loss. Thank you professor @shemul21 for this important lecture about the support and resistance zones.
This is all about my homework post and I thank you to professor @shemul21 for such a valuable topic that was really very educational and helpful for our personal life too.
I'm reposting this Trading post as it was not curated. Here is the previous post.