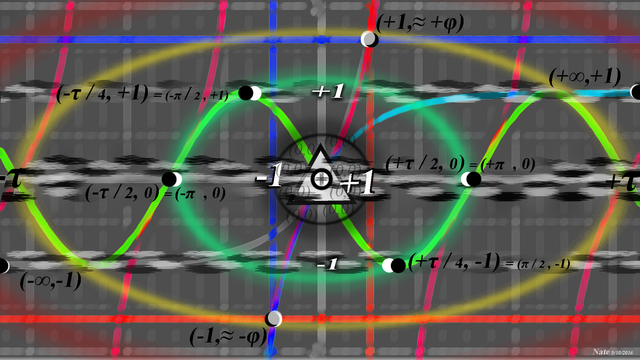
Sinner's Tan. A digital art progression (drafts from start to finish) inspired by math, astronomy, and mysticism.
Final Version:

Brief Explanation of Influences:
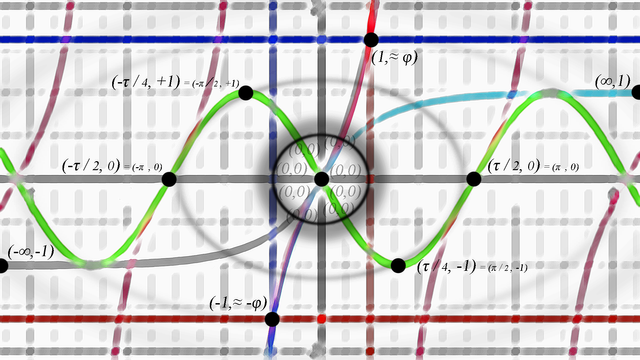
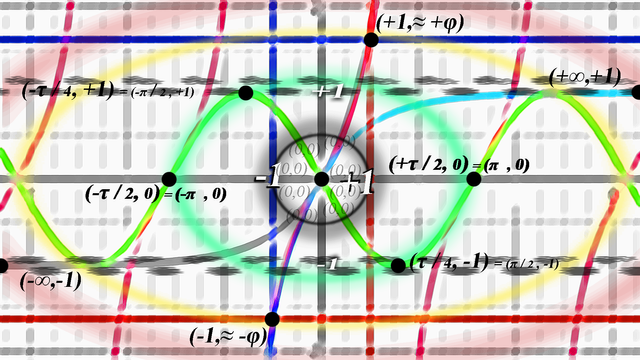
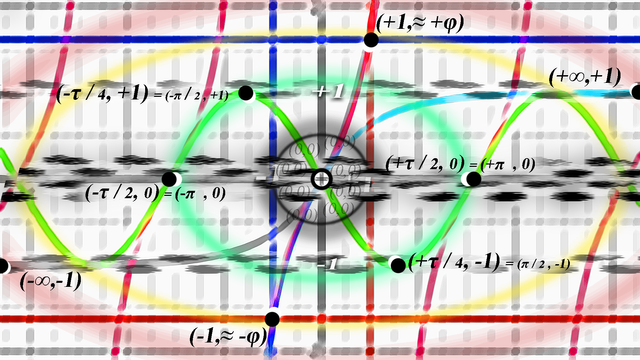
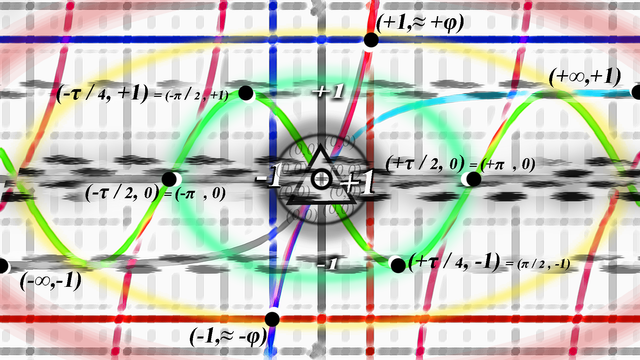
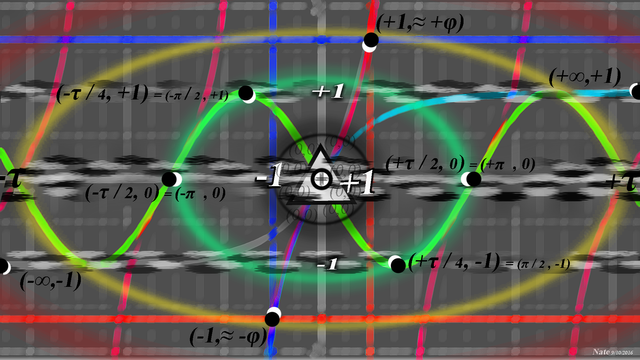
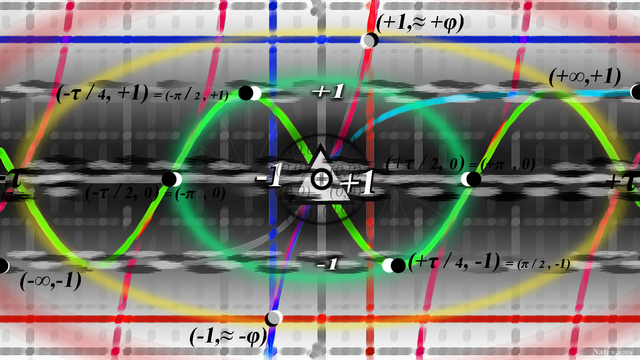
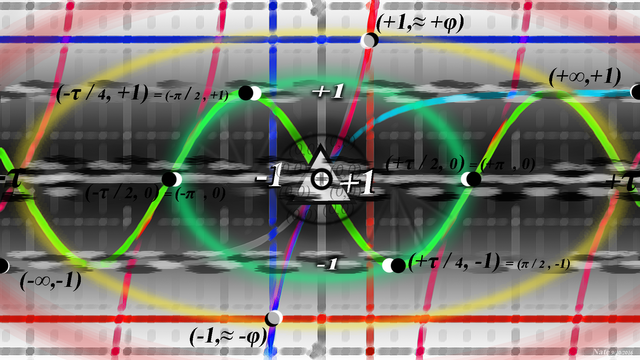
-Tau, Phi, e, Math, and Trigonometry: The piece includes several constants and trigonometric functions. The foundation for the picture is based off the following functions: -sin x, tan x, 1-e^(-x), (e^x)-1, x=-1, x=1, y=1.618, y=-1.618.
Tau 𝛕 :If you ever took trig, you have probably heard about Pi. In trig, a full turn around a circle equals 2*Pi, which can get pretty confusing when you are first learning. Tau is equal to Pi / 2. This make it easier to understand trig because you can think of Tau as a "Turn" because it represents one full turn around a circle. To learn more about Tau, watch the video titled "No, really, pi is wrong: The Tau Manifesto by Michael Hartl".
Phi 𝛗 : You may or may not have heard about this curious mathematical constant, but you have definitely seen it. It has been found to be very common in natural creations (,like the way trees and flowers arrange their petals and branches,) and in the anatomy of life (, like in the proportions of animal and human body parts). There is an amazing video by Cristóbal Vila called "Nature by Numbers" which shows some beautiful examples of Phi turning up in nature.
The base of the natural logarithm e: This number comes from the math behind compounding interest pushed to the limit of compounding infinitely / continuously at every moment. Another interesting thing about e is that, in calculus, the function e^x is the only function equal to its own derivative. Numberphile did an excellent video about this number (search for Euler's Number).
-Astrological Zodiac: Inside the green circle in the center, there is one full sine wave. It simultaneously represents the four seasons of the year and the twelve Zodiac signs. The upper half is the tropic of Cancer and the lower half is the tropic of Capricorn. You can find this sine wave on most globes, labeled as such. The points (-π, 0) and (+π, 0) both represent the March equinox and the center is the September equinox. The highest point on the left side is the June / Summer solstice (the longest day of the year) and the low point on the right is the December solstice (shortest day of the year). If you are curious, check out the Wikipedia articles on this stuff and you will see there is a little bit of method to my madness.
I got interested in zodiac signs and viewing them more scientifically after reading a book called "The Geometry of Meaning" by Arthur M. Young. In it, he explains how he connects each fundamental physics equation to each sign and then a bit about how he used those ideas to design Bell's first helicopter. Pretty interesting stuff.
-Moon Cycles: I added those dots that look kind of like phases of the moon because they looked cool and seemed to fit with the astronomy / astrology theme.
Let me know what this makes you think of or what it looks like to you, I am very curious.
Thanks!
And here is the progression of how it evolved:
1:
2:
3:
4:

5:
6:
7:
8:
9:
10:
11:

12:
13:
14 - FINAL VERSION (again):
It seems that somehow a paragraph or two in my explanation got cut off, I will rewrite it soon. (Edit: it has now been fixed)