Introduction to the Principles of Crypto Analysis - Crypto Academy S4W7 - Homework Post for @imagen


1). What are the differences between Fundamental Analysis and Technical Analysis? Which one is used most often?
Before the cryptocurrencies came to this game, Forex, stocks & commodities were the only interests of the traders. In any market, whether it is forex, stocks, commodities or cryptocurrencies, traders have developed a variety of strategies to identify the pattern of the market and they are actively following it. There are various factors by which the moves of the market are predicted. These factors are the projects, their problem-solving approach, the interest of buyers, their founders, the interest of other big institutions, the roadmap etc. Identifying the market pattern and predicting the next possible moves of the market is called Analysis of Market. The analysis is mainly of two types;
A). Fundamental Analysis
B). Technical Analysis
Difference between Fundamental analysis and Technical Analysis.
| Fundamental Analysis | Technical Analysis |
|---|---|
| The fundamental analysis depends on the news | The Technical analysis depends on the trading chart |
| It is useful for the investors | It is useful for the traders |
| This is used to invest for the long term. Short term profit/loss is ignored | Intention of short term profit |
| In this, the balance sheet of the company, loss/profit, asset/liabilities is observed. | In this, prediction is done according to different indicators. |
| In crypto coins, this observes the roadmap and project team activity | Here, the market is analysed after looking at the price action on the chart. |
| Here, the history and present data is observed | Here, only the history of coin/stock/asset is observed. It doesn't depend on the present data. |
Which analysis is most often used?
- According to my opinion, it is best to use both the analysis together before investing any coin to get the best results.
Using technical analysis in any asset helps us in reading the trader psychology with the help of price action. If added with fundamental analysis, we get more surety in investment in a particular asset. - In cryptocurrency, traders are mostly inclined towards a fundamental analysis because any good news brings huge movement in a very short time. Also, investing for the long term in any crypto project, traders look at every fundamental aspect of the project.
- In other markets, technical analysis is more likely to be observed and profits are gained using the price action by setting some technical indicators.
- Fundamental analysis is much easy to apply because the trader can take decisions only by reading the news. But as a technical indicator is more complex and needs much expertise, it is less preferred by most traders.
2). Choose one of the following crypto assets and perform a Fundamental Analysis indicating the objective of the Project, Financial Metrics and On-Chain Metrics.
Cardano (ADA)
Solana (SOL)
Terra (MOON)
Chiliz (CHZ)
Polkadot (DOT)
To complete this question, I will pick SOLANA (SOL) crypto-asset because I have made much profit by trading in this asset. I have also done research before investing in it so it will be easy for me to explain the fundamentals of SOL.
So, let's get started.
- Solana (SOL)
Objective of the project Solana ( SOL)
According to the detail given on the website of SOLONA, it is the token that has its own blockchain which focuses mainly on the development of decentralized apps(DApps) and provides scalability to ease and faster the transactions. The transactions in Solona are very cost-effective. It completes around 2000+ transactions per second and per-transaction costs $0.00025.

- Use of SOL coin:
- Due to the very fast and cheap transaction fee it is used in transferring the funds.
- It is used in the development of decentralised apps.
- It is used in staking.
- Financial Metrics:
While doing financial metric analysis we will mainly check the current trading price, ranking on the coinmarketcap, market capitalization, volume, circulating supply & maximum supply.
For getting these details, we simply open the website of coinmarketcap and search the SOL coin.
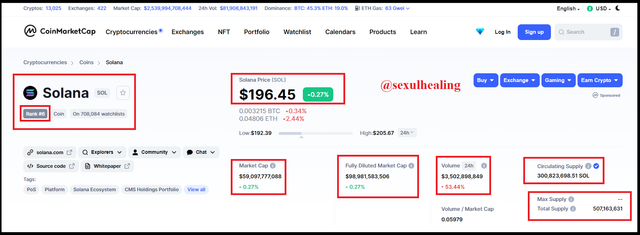
- Price- $196.45
- Rank- 6
- Market Capitalization is $59,097,777,088
- Volume is $3,502,898,849
- Circulating supply is 300,823,698.51 SOL
- Fully diluted market cap. is $98,981,583,506
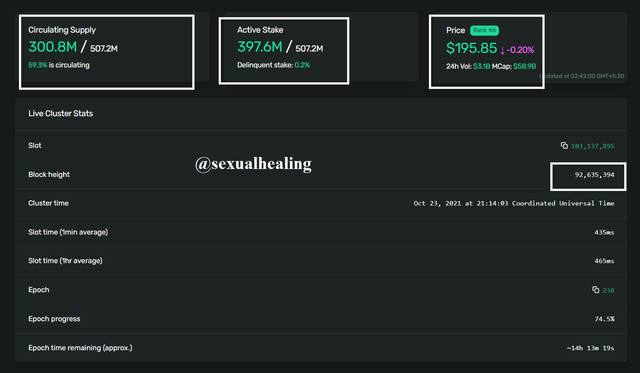
- On-Chain Metrics:
To get the idea of On-chain metrics, I visited the block explorer section on the solona blockchain website.
 source
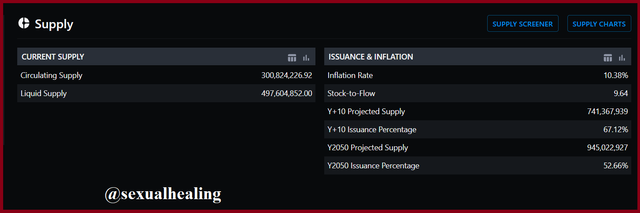
The total staked amount at the time of making this assignment was 397.7 million out of 507.2 SOL.
3). Make a purchase from your verified account of at least 10 USD of the currency selected in the previous point. Describe the process. (Show Screenshots).
To complete this question, I will purchase Sol from my verified binance account.
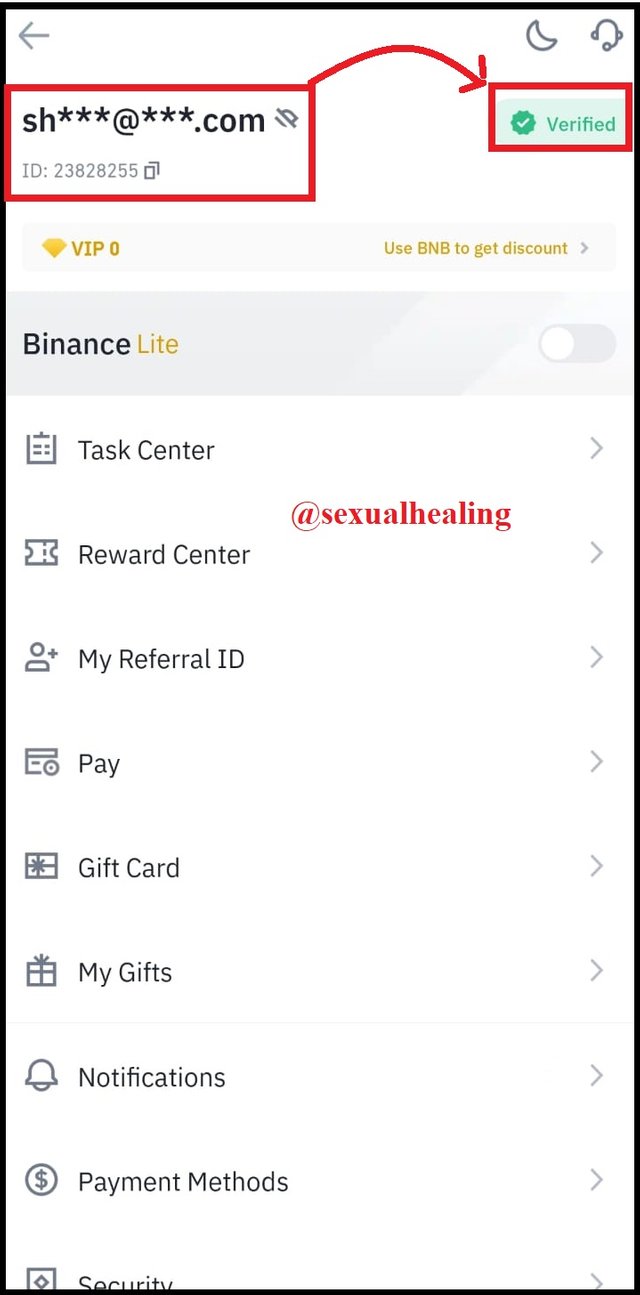
The above screenshot shows my verified binance account.
Now, moving into the wallet section, here we can see that I have 12.07 USDT in my account. I will use it in the purchase of SOL coins.
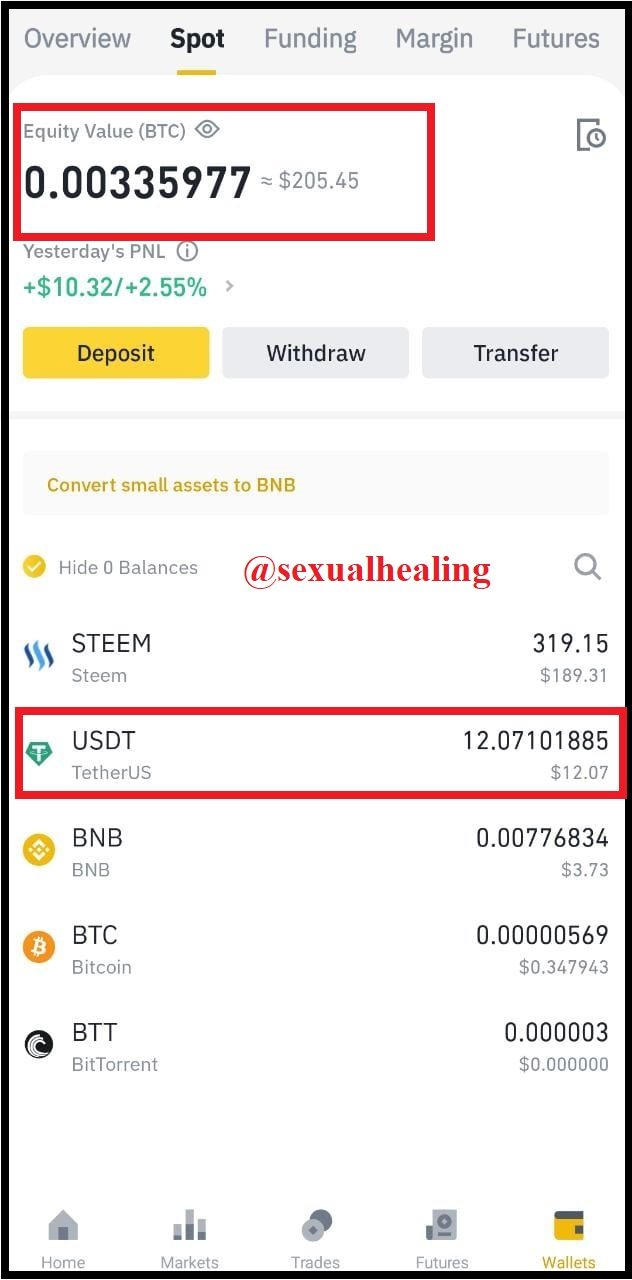
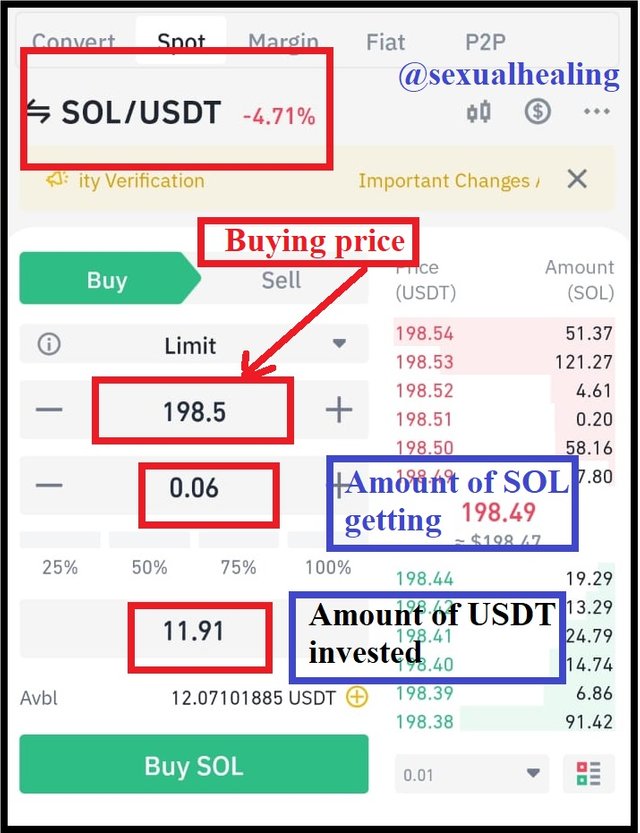
So, directly moving to the market, I searched for the SOL/USDT and bought SOL coins.
The SOL was bought at 198.5$ price. It used 11.91 USDT for 0.06 SOL.
In the below screenshot, I am showing the completed trade of SOL/USDT.
.jpeg)
In the below screenshot, you can see the SOL coin in my wallet
.jpeg)
4). Apply Fibonacci retracements to the previously selected asset with a 4-hour time frame on the platform of your choice. Observe the evolution of the price at 24 and 48 hours, did it go up or down in value? Look to identify resistance and support levels. (Show Screenshots at 0, 24 and 48 hours of purchase where the date and time are observed).
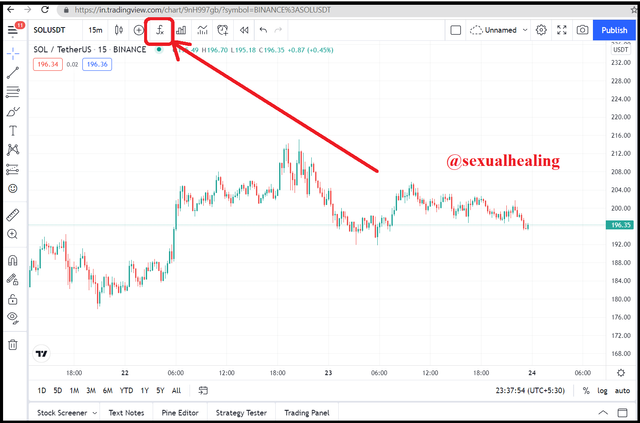
In this part of the question, I am opening the website of Tradingview to open the chart of SOL/USDT.
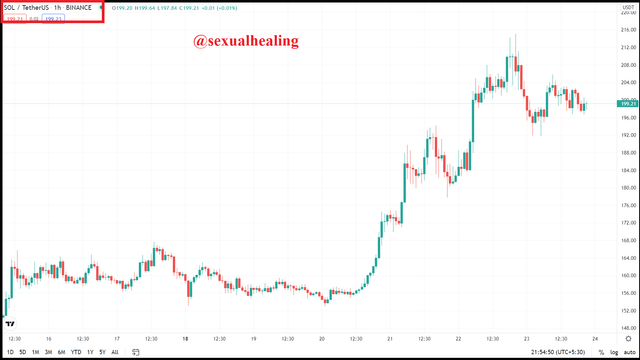
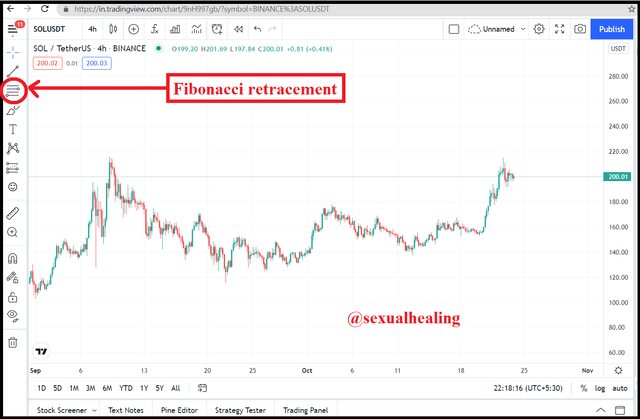
Now, I will apply Fibonacci retracement to the SOL/USDT pair with a 4H candlestick chart.
To apply Fibonacci retracement lines, I clicked on the tool options given on the left side of the chart.
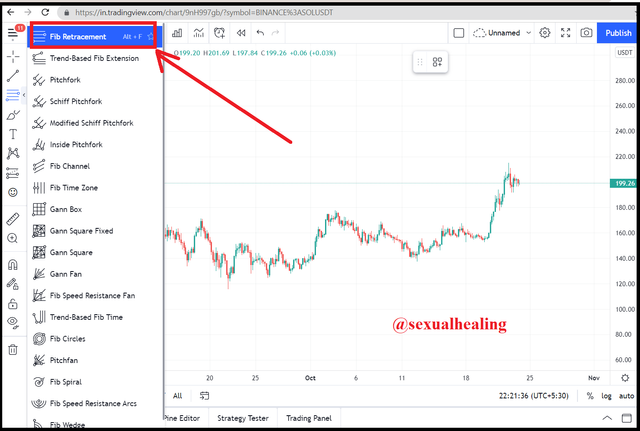
Select Fib Retracements
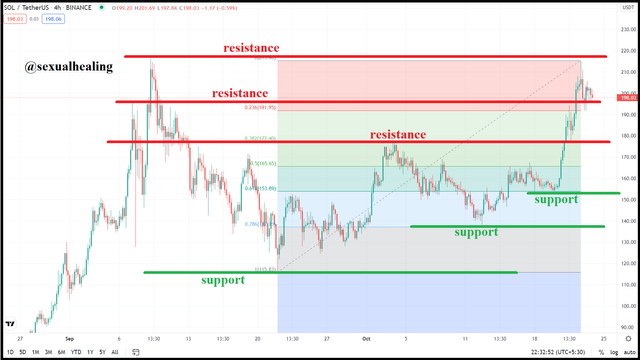
In the below chart, we can see that if we count day-0 at the 20th October, Sol took 1st retracement, after 24 hours that is 21st October, it took 2nd retracement. Again after 48 hours, it took 3rd retracement.
Ultimately, in all retracements, the trend is going upwards and it is making high to high.
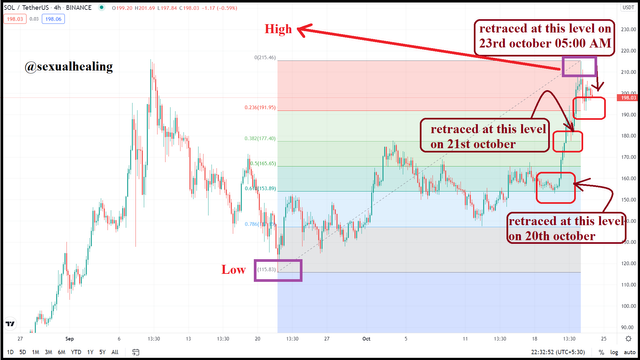
In the chart below, I have made the resistance lines and support lines to check the retracements possibilities.
5). What are Bollinger Bands? How do they apply to Crypto Technical Analysis? With which other tool or indicator do you combine Bollinger Bands to analyze a Crypto? Justify your answer.
The Bollinger Bands are the technical indicators that work on the set of two standard deviations and a simple moving average. These are considered as three bands, upper band, lower band and middle band. Usually, the candlestick tries to stay between the upper and lower band but sometimes it breaks either band and results in breakout.
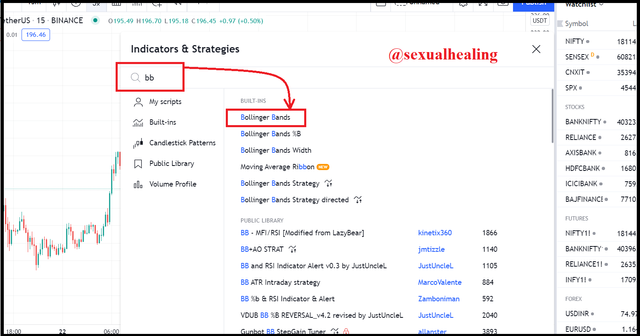
Now, I will apply the Bollinger Bands on the chart of SOL in the trading view website.
After clicking on the Fx, we get the search bar to add the indicators. I am typing BB(Bollinger Bands) and adding it.
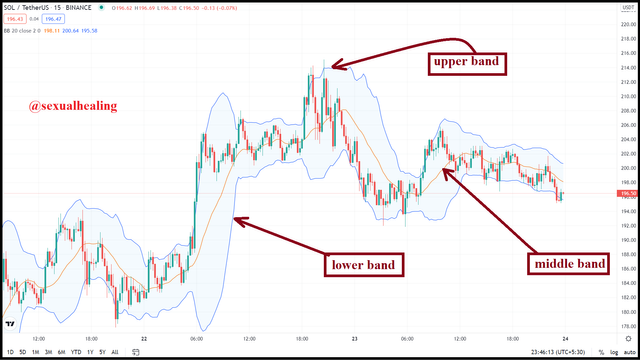
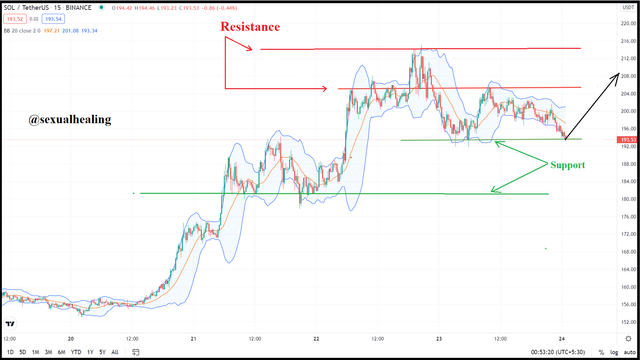
The below screenshot is showing the chart added with the technical indicator "Bollinger band" having the Upper band, lower and middle band. We can see the candles are moving inside and properly following Bollinger bands. Here upper band acts as resistance to the upward motion of the market and the lower band acts as a support to the downward motion of the market. The middle line is a simple moving average which tells us the trend where the market is currently moving.
- Apply Bollinger Band to Crypto Technical Analysis:
In the below chart, I have applied BB on the Solana coin. Usually, people say that the Bollinger band work more accurately on markets other than cryptocurrency. But, I can say this is actually a myth. The below chart is in the 15-minute time frame and it is working perfectly.
Although the upper and lower lines of BB tells us the resistance and support level for more confirmation we can apply the Pivot point to the chart. For short term trading, a trader usually uses a smaller time frame to get more accurate short term results.
- Other tool or indicator I combine with Bollinger Bands to analyze a Crypto:
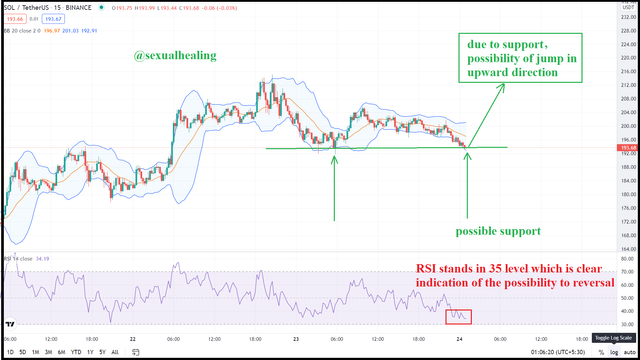
I use the Relative Strength Index combined with Bollinger bands to get surety in my trading positions.
RSI have two standard levels which are at 30 and 70. Level on 30 is usually considered as an oversold zone so a trader can open the position here if the candles are touching the lower Bollinger bands. Again, level 70 is usually considered an overbought zone and this is a sell signal for a trader.
So, in this was a trader decides to open or close a trade to earn a good profit using these technical indicators.
6.) Conclusions
In the part of the conclusion to this task, I understood that for opening a profitable trade, both technical and fundamental analysis should be used in coordination because it increases the accuracy of the decision. Fundamental analysis is easy to perform and involve knowledge of project durability, founders, whitepaper, on-chain metrics and knowing about the actual price of the currency. If the currency is below the actual worth, definitely it is the signal of investment but if its cost is overvalued, a trader can drop his decision. Also, for short term trading, technical analysis plays an immense role. By looking at the chart, analysing the support and resistance lines, knowing the trends of the market in different time frames a trader can earn a good profit from the market.
But, if both analysis methods are used, it can protect the trader from bad investments.
Do not use the #club5050 tag unless you have made power-ups in the last 7 days that are equal or greater than any amount you have cashed out.
Ok...Thanks for giving instructions. I will keep in mind.
Gracias por participar en la Cuarta Temporada de la Steemit Crypto Academy.
Continua esforzandote, espero seguir corrigiendo tus asignaciones.